Sambus COVID-19 Hub

Empower better decision-making around COVID-19
The spread of the new coronavirus disease 2019 (COVID-19) continues in West Africa as local governments are putting all measures necessary to mitigate it. Sambus Geospatial Limited is helping the local community with location intelligence, geographic information system (GIS) and mapping software, services, and materials that people are using to help monitor, manage, and communicate the impact of the outbreak. Learn how to use this resources to effectively help your community or organization respond to this emergency.
COVID-19 Situational dashboards for West-African states
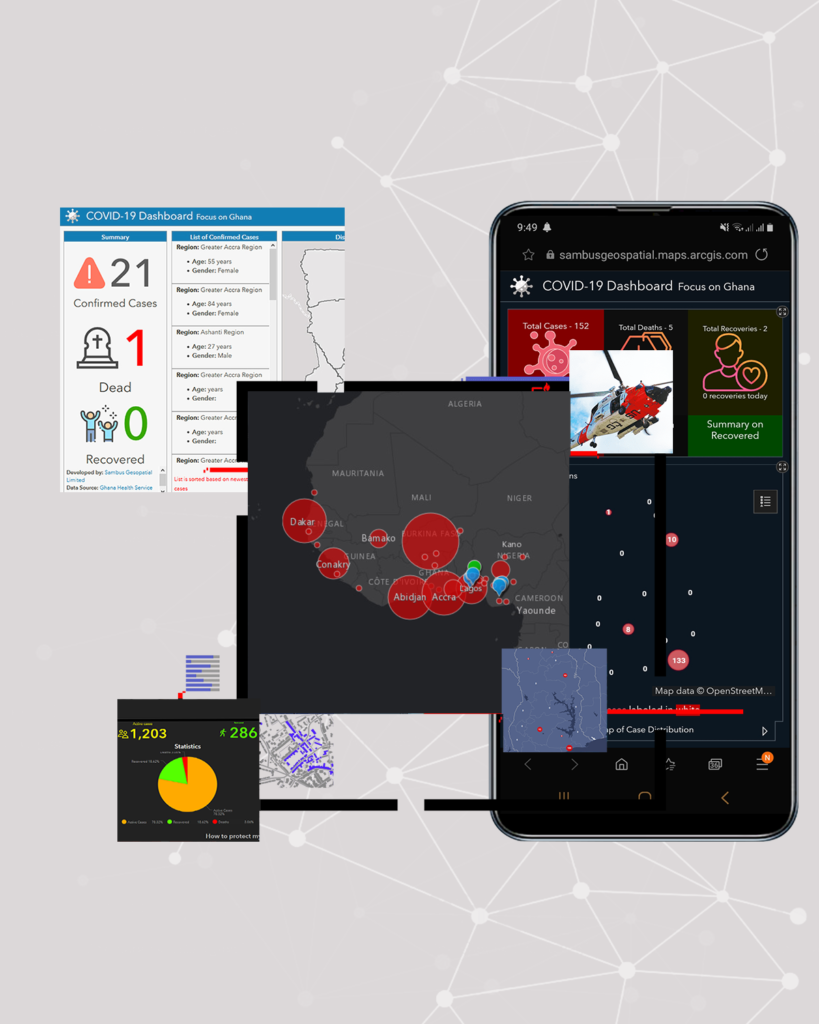
Visualize all new updates on the outbreak of the coronavirus disease in West Africa on a regional and state levels using situational dashboards developed to support health workers, with data sourced from the local Ministry of Health and the World Health Organization.
See situational dashboard designed to strategically visualize and respond to the spread of COVID-19 in Ghana on a regional level, coupled with global data from World Health Organization (WHO).
Gain access to every essential data on all coronavirus disease cases in Nigeria, represented on a situational dashboard designed to monitor and combat the spread of the disease on a National Level
Ask for emergency GIS help from Esri's Disaster Response Program
To help public health agencies and other organizations jump-start their response to coronavirus disease 2019 (COVID-19), Esri is providing the ArcGIS Hub Coronavirus Response template at no cost along with a complimentary six-month ArcGIS Online subscription with ArcGIS Hub Basic and ArcGIS Insights. Click the button to request for assistance or contact Sambus Geospatial for more information.
Keep your data simple to understand with a mobile ArcGIS dashboard
Less is more when it comes to ArcGIS Dashboards for Smartphones. A complementary platform designed to keep the situational analysis simple for it’s user, refining all indicators and gauges with the best infographics, as information can be consumed quickly and action can be taken immediately in response to it.

5 steps to COVID-19 response
As global communities and businesses seek to respond to the COVID-19 pandemic, you can take these five proactive steps to create an instant picture of your organization’s risk areas and response capacity.
