What’s New in Esri Demographics and Living Atlas – June 2023
In June, we are proud to announce a new era in accessing ready-to-use demographic data from Esri. Esri’s 2023 U.S. Updated Demographics have been released in an ArcGIS Online hosted feature layer curated into ArcGIS Living Atlas that enables you to easily integrate demographic data into your maps, apps, and projects.
Using the new layer
Esri’s Updated Demographics contains thousands of detailed demographic variables across a multitude of categories such as population, age, race and ethnicity, education, households, income, and more – all created by our team of talented demographers.
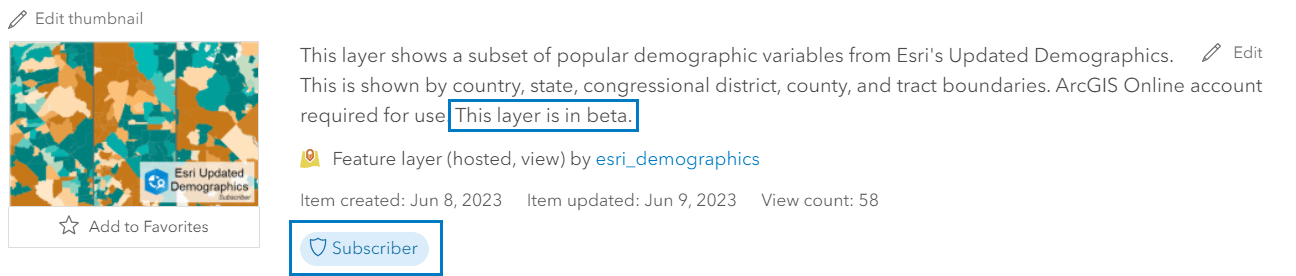
We have taken a subset of the most popular demographic attributes from this suite of data and compiled them into a multi-scale Online hosted layer: Esri Updated Demographics Variables. This layer contains Country, State, County, Congressional District, and Tract level geographies with appropriate visibility ranges so as you zoom in, you see increased levels of detail. Congressional District is turned off by default, but easily enabled when needed.
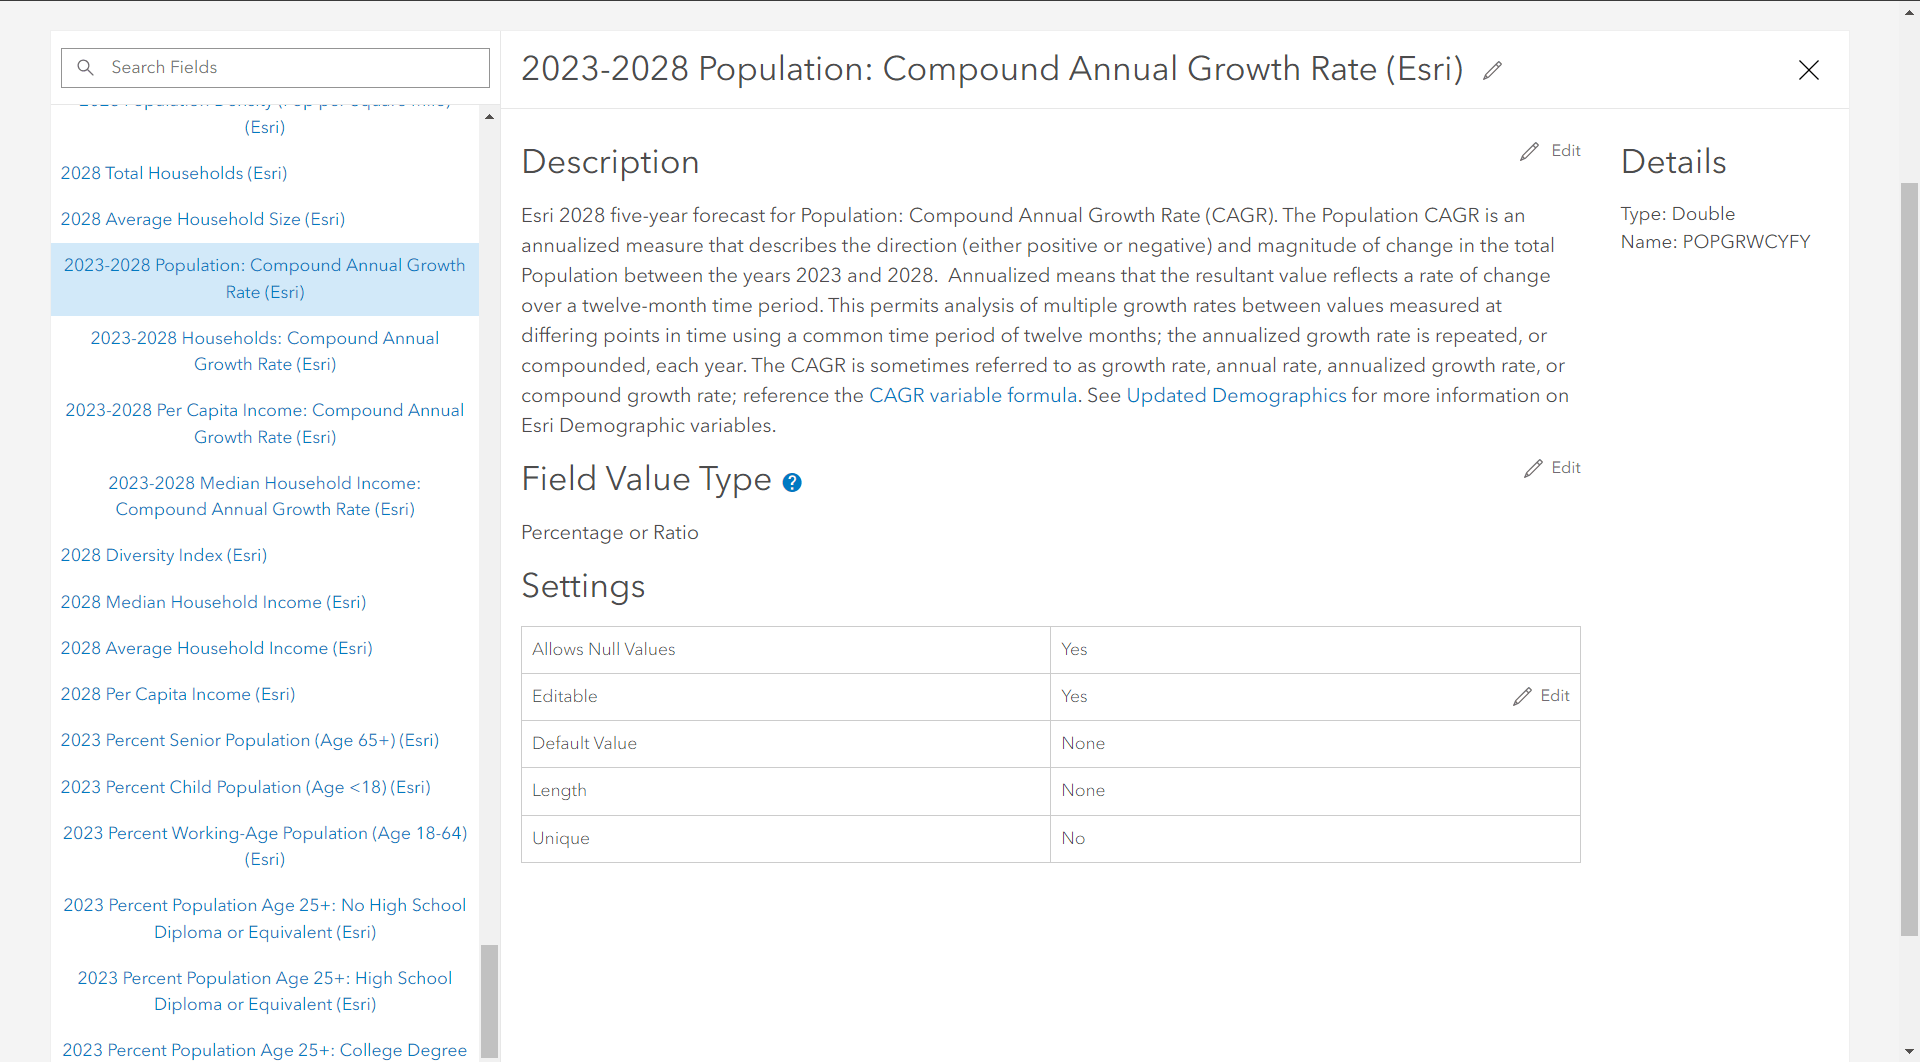
The layer is also complete with detailed documentation on the item details page and field metadata so you can feel confident about using the data. For example, each field contains a definition of the variable with links to methodology documents to provide a clear understanding of what the attribute means. This definition is viewable on the Data tab of the item details page by selecting a field.
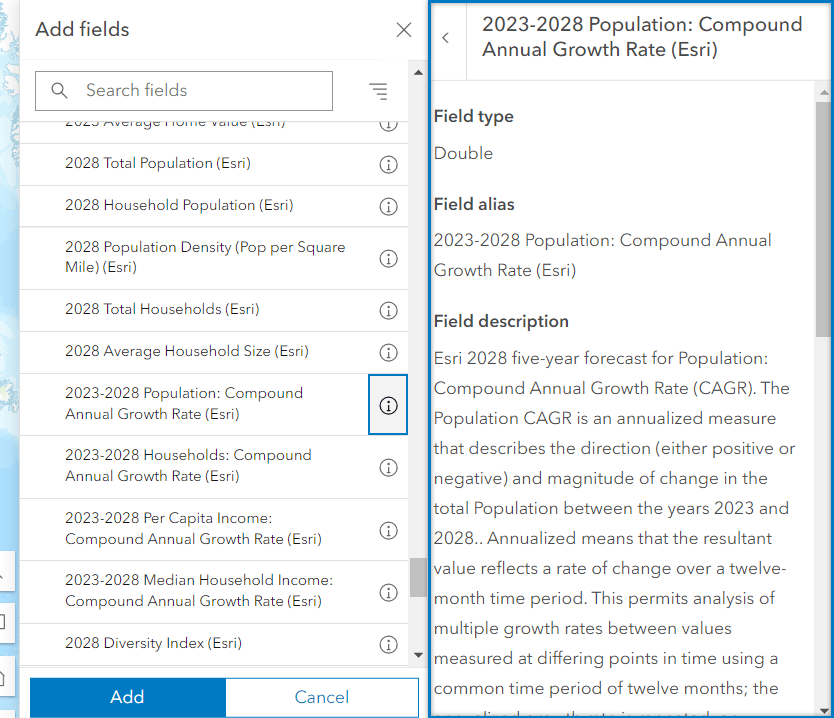
Or by selecting the information icon next to a field when changing the layer style.
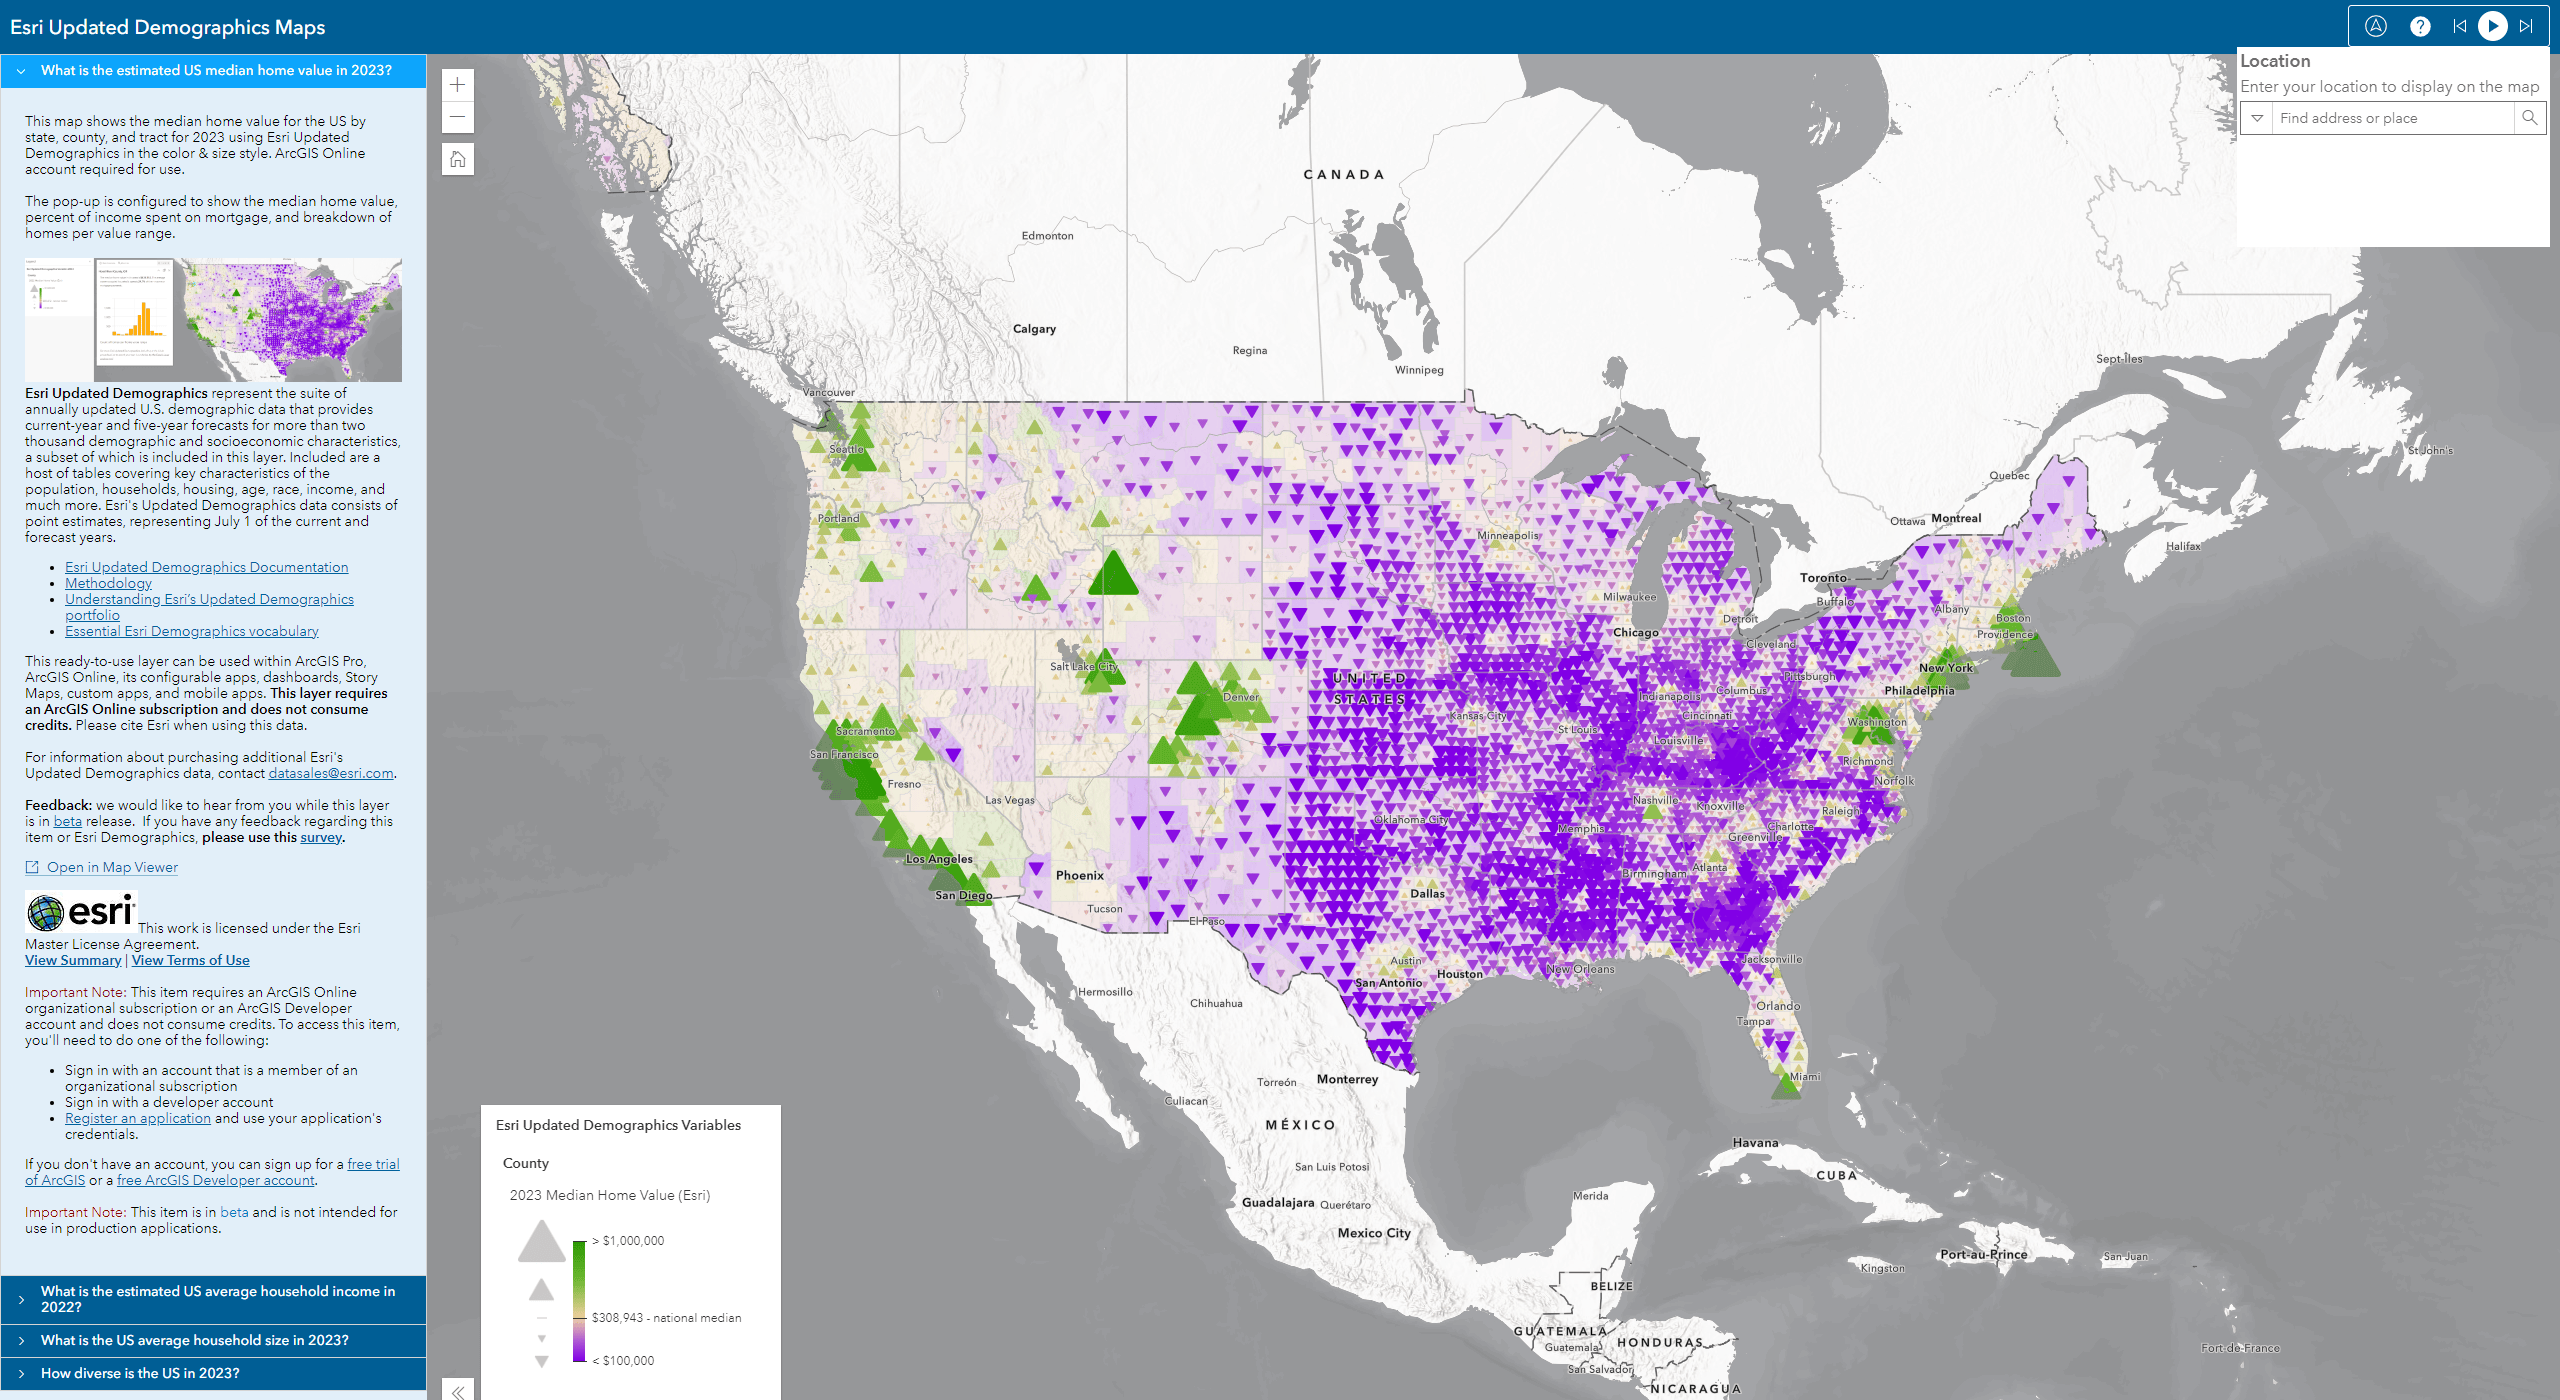
The layer is also configured with default symbology to get you started as soon as the layer is added to a new or existing map. The pop-up is preconfigured so when clicking a feature, you immediately see useful information about the area.
Hosted feature layers are fast, flexible, and readily accessible throughout the Esri product suite in ArcGIS Online, configurable apps, ArcGIS Pro, and more. From the layer visibility to the pop-ups and symbology, each layer can be configured to suit your project’s exact needs. This layer also supports the use of Arcade to create new attributes on the fly for pop-ups or ArcGIS Dashboards.
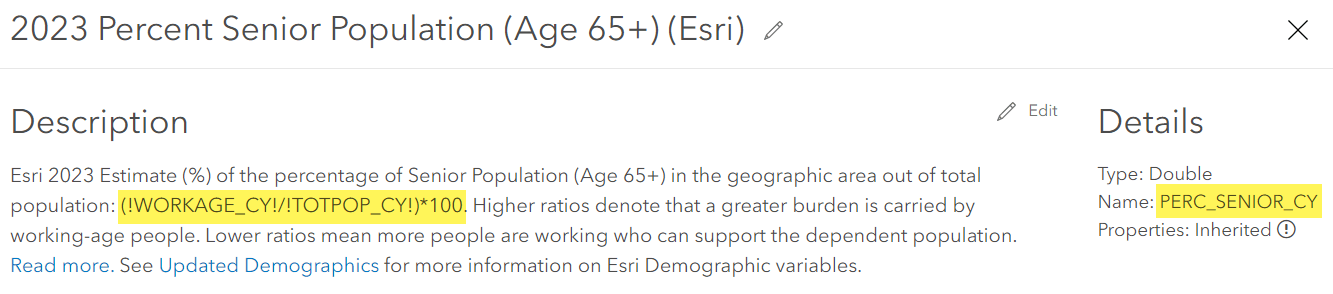
However, for additional ease of use, we have included calculated percentages such as 2023 Percent Senior Population (Age 65+) (Esri) for topics where percentages are useful. These are findable in the field list with field names beginning with ‘PERC’. The long description includes the equation used for the calculation.
Ready-to-use maps
In addition to the layer in ArcGIS Living Atlas, we have created several maps showcasing various topics and mapping techniques. These include:
- What is the estimated US median home value in 2023?
- How diverse is the US in 2023?
- What is the US average household size in 2023?
- What is the estimated US average household income in 2023?
Additional ready-to-use maps will continue to roll out over time into ArcGIS Online and Living Atlas.
What’s changing from last year?
In previous years, we have created a set of USA Esri Demographics map image layers and web maps for Living Atlas. As we are entering the new era of hosted layers, last year’s 2022 Esri U.S. Demographic maps will no longer be discoverable from within Living Atlas. However, they are still discoverable in ArcGIS Online. These include items covering Esri’s Updated Demographics, Tapestry, Consumer Spending, and Market Potential data.
Additional variables and geography levels not included in the feature layer are available for purchase from our Data Sales team. This includes State, Congressional District, County, Tract, Block Group, County Subdivision, and Core-based Statistical Area (CBSA). Please reach out to datasales@esri.com for more information.
Esri Updated Demographics are also available in ArcGIS Business Analyst or through ArcGIS GeoEnrichment Service.
Final Thoughts
You may notice the layer is marked as Subscriber and considered in beta. This means that you need to be logged into your ArcGIS Online subscription for access, but it does not consume credits. As this is a new method of serving Esri Updated Demographics, this layer is in beta so that we can continue to improve its content for our customers.
We’d love to hear from you!
Demographics are a powerful tool to add greater insight into your map and analysis. It can provide context and information about your place of interest while being easy to use and customizable. We invite you to try out this layer in your GIS workflows Online, in Pro, Dashboards, Insights, or web apps.
If you have any feedback regarding this item or Esri Demographics, please use this survey.