Examine data accuracy in ArcGIS Business Analyst using ACS reliability estimates
Have you ever wondered about the Reliability button located next to the count and per cent options in the data browser when searching for a variable in ArcGIS Business Analyst?
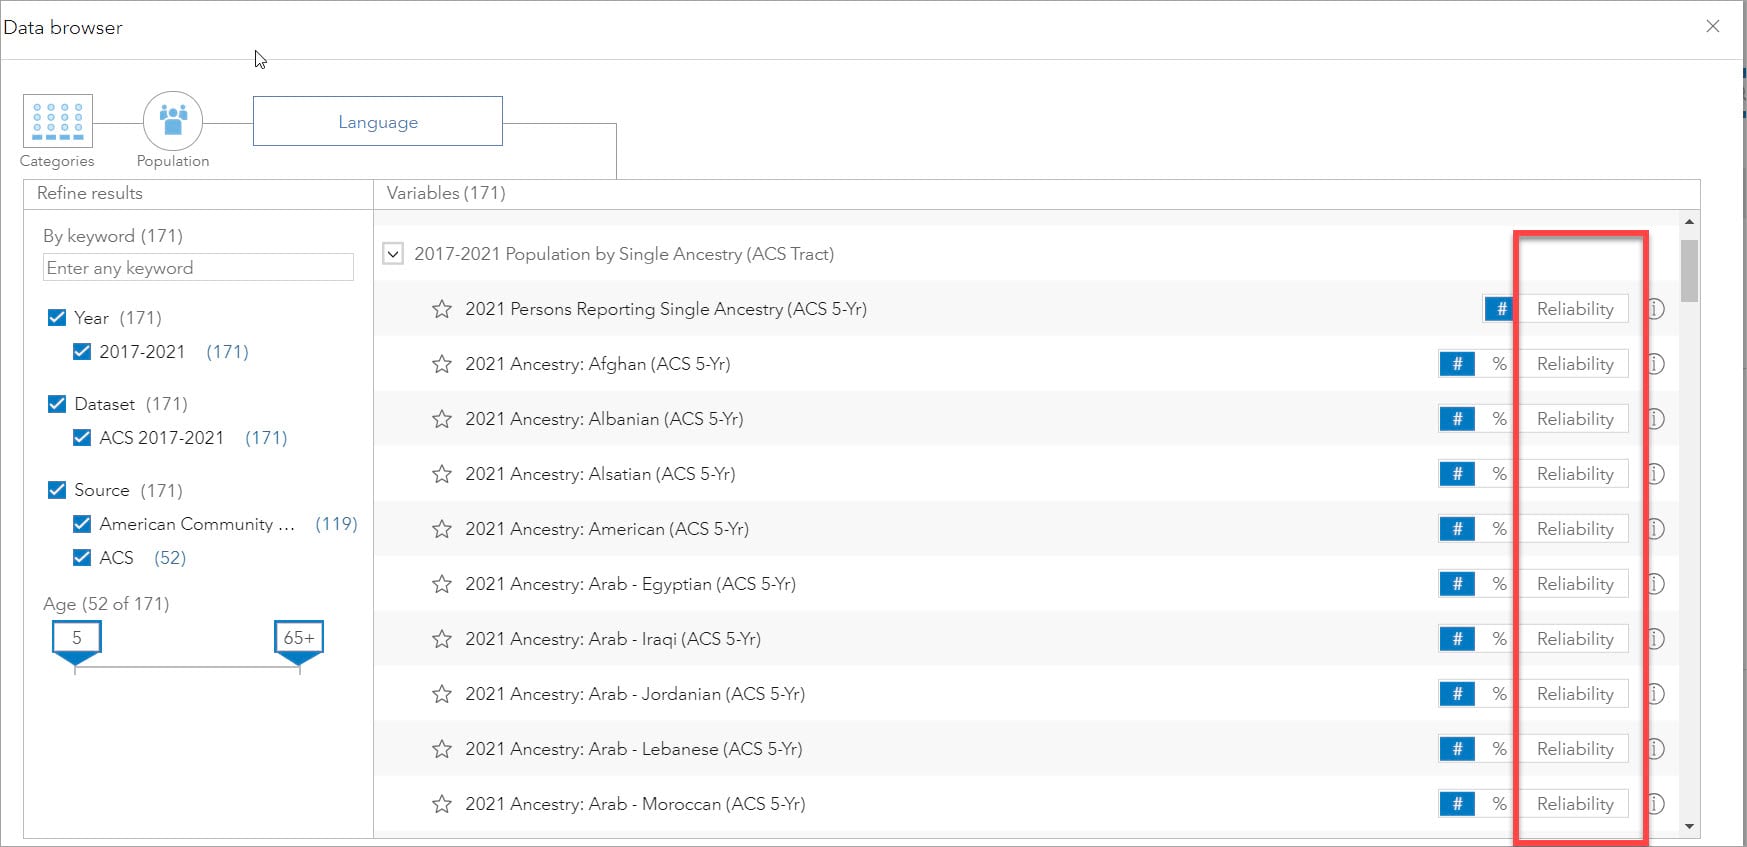
Variables that show the Reliability button in the data browser have—in addition to other calculation options like count and percentage—a reliability score.
What is reliability?
Simply put a variable’s reliability score serves as an indicator of the reliability of American Community Survey (ACS) estimates. The Reliability button only appears on ACS variables and helps users understand the level of confidence they can have in the data provided by ACS. This feature is essential for making informed decisions based on accurate and reliable information within ArcGIS Business Analyst.
In this blog article, we provide a concise overview of the reliability score, its calculation, and its practical application within Business Analyst.
Why is it important to verify the reliability of ACS data?
The American Community Survey (ACS) data is one of the most commonly used public datasets for understanding population and housing characteristics in the U.S. However, it is crucial to interpret the data accurately. To this end, Esri demographers analyze the raw data and assign reliability scores to ACS variables.
The ACS employs a continuous measurement, also known as a rolling sample, where a small percentage of the population is sampled every month. Due to the relatively small yearly sample sizes, the ACS survey pools 60 months of data to produce reliable estimates for small areas. Even when we use the 5-year estimates from ACS though, there will always be differences between the sample and the total population because of the fact that the entire population is not surveyed. Sampling error arises when only a portion of the population is surveyed to estimate the characteristics of the entire population. To address this issue, the ACS reports for most standard census geographies include margins of error (MOEs) with the estimates.
The MOE measures the variability of an estimate resulting from sampling error. This tells data users that the estimate is not a precise figure but instead represents a range of potential values. Hence, the MOE serves as a crucial metric for data users, allowing them to understand the range of uncertainty for each estimate. This range can be calculated with 90 per cent confidence by adding or subtracting the MOE to/from the estimate. The range of values is referred to as the ‘confidence interval,’ indicating that the U.S. Census Bureau has 90% confidence that the population count falls between the upper and lower values. For instance, if the ACS reports an estimate of 120 with a margin of error of +/- 30, there is a 90 per cent likelihood that the total population value falls between 90 (120 – 30) and 150 (120 + 30). A larger MOE indicates lower precision in the estimate, reducing confidence in its proximity to the true population value.
Statistical margins of error have significant implications for decision-making among market analysts, business owners, and policymakers. Suppose a company conducts a survey to estimate the percentage of potential customers interested in buying a new product. The survey results show that 75% of respondents are interested in the product, with a margin of error of +/- 10%. This means that the true customer interest level could be as high as 85% (75% + 10%) or as low as 65% (75% – 10%). The larger the margin of error, the less confidence the company can have in the estimate’s accuracy, affecting their decision-making process.
Esri’s reliability thresholds
Assessing the quality of an estimate solely based on the margin of error (MOE) can be challenging. To simplify this assessment, Esri has introduced reliability symbols in their maps and reports. The reliability symbols are divided into three categories: high, medium, and low reliability.
The reliability estimates are derived from an estimate’s coefficient of variation (CV), which measures the amount of sampling error relative to the size of the estimate. When the error is large relative to the estimate, the coefficient will be large, indicating lower reliability. As the coefficient increases, the reliability decreases.
- Green: High reliability —Small CVs (less than or equal to 12 per cent) are flagged green to indicate that the sampling error is small relative to the estimate, and that the estimate is reasonably reliable.
- Yellow: Medium reliability —Estimates with CVs greater than 12 and less than or equal to 40 are flagged yellow—use with caution.
- Red: Low reliability —Large CVs (over 40 per cent) are flagged red to indicate that the sampling error is large relative to the estimate. The estimate is considered unreliable.
- Some estimates do not indicate reliability. In these cases, either the estimate or MOE is missing, or the estimate is zero.
Read an in-depth explanation of this methodology from Esri’s data team.
These predefined thresholds help users quickly assess the usability of an American Community Survey (ACS) estimate. In the following section, we provide a brief explanation of the calculation of an estimate’s coefficient of variation and its interpretation in relation to the reliability of that estimate.
How is reliability calculated?
The coefficient of variation (CV) is calculated as the ratio of the standard error to the estimate itself, expressed as a percentage. We can calculate it using the following formula:
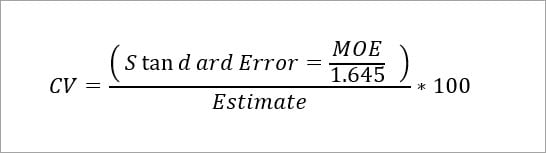
Using this formula, we first obtain the standard error by dividing the margin of error (MOE) by 1.645 (for a 90 per cent confidence interval) and then divide it by the estimate. The result is then multiplied by 100 to express the CV as a percentage.
For example, consider an estimate of 90 with a margin of error of +/- 20. The CV for this estimate would be 13.5 per cent:
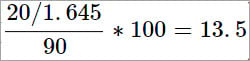
According to the reliability thresholds established by Esri, it is apparent that we need to exercise caution when using this estimate, as the sampling error represents more than 13 per cent of the estimate. This indicates that the estimate may not be highly reliable.
How can we use reliability scores in ArcGIS Business Analyst?
Suppose you are a business analyst working for a healthcare company. Your goal is to identify the population lacking health insurance. To achieve this, you utilize ArcGIS Business Analyst Web App, which allows you to access the relevant variable through the data browser. The data browser not only provides the count and percentage of the uninsured population but also offers the reliability of the estimate.
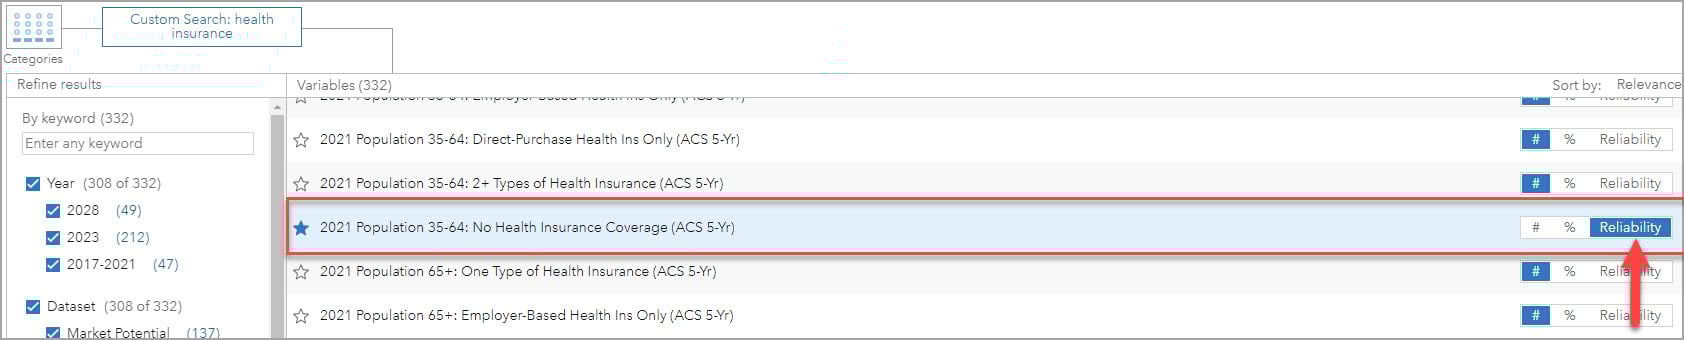
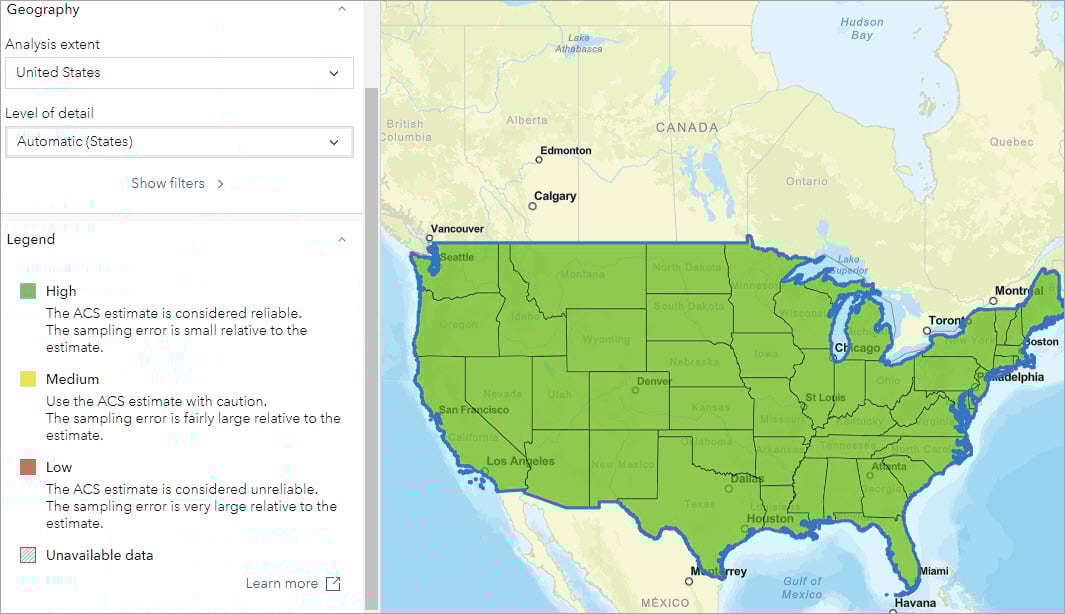
When you select Reliability for the population (35-64) variable shown in the image above, you will get a map that displays the reliability of ACS data for a population in the U.S. between the ages of 35-64 with no health insurance coverage at the state level. Looking at the map legend on the left panel, we can see that all data is reliable at the state level.
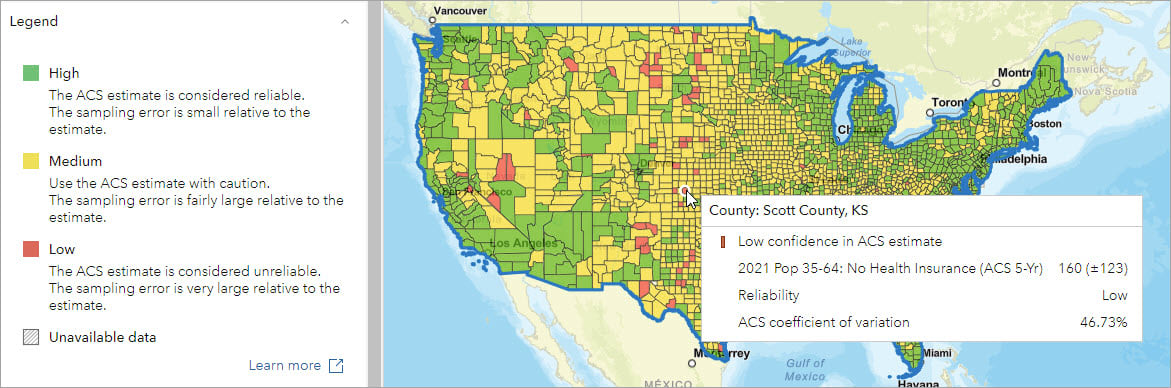
However, when we change the analysis extent to counties instead, we see that there are several counties in the U.S. for which this data is unreliable since the sampling error is very large relative to the estimate.
How can we improve the reliability of our data?
ArcGIS Business Analyst provides reliability thresholds for ACS estimates. Use this information to identify estimates that may need additional caution due to higher coefficient of variation and lower reliability.
In addition to this tool, users can opt for larger geographic units if the reliability of estimates is a concern. Aggregating data into larger geographic units generally results in a decrease in the margin of error (MOE).
To further improve reliability when comparing different areas using ACS data, the Census Bureau recommends focusing on percentages rather than estimate values, since percentages are less influenced by variations in population size.
Overall, by using the reliability thresholds in ArcGIS Business Analyst and implementing these techniques, you can improve the reliability of your data, reduce CV, and minimize MOE, leading to more accurate and informative data for analysis, decision-making, and planning.
For additional information about reliability and margins of error, see Esri Methodology Statement June 2023 and the blog article The Importance of Margins of Error and Mapping.