How to collaborate across license levels in ArcGIS Business Analyst Web App
ArcGIS Business Analyst Web App has two license levels: Standard and Advanced. With a Standard license, you can create sites and maps, explore data, and run infographics in Business Analyst. The Advanced license provides further analytical workflows and the ability to add custom data and build your own infographic templates.
In the Business Analyst help documentation, you’ll notice a licensing note on workflows that require an Advanced license:

Understanding the difference between the Standard and Advanced Business Analyst license types is simple enough. But many organizations possess multiple licenses: some Standard, and some Advanced. How do users with different license types work together? This article provides an overview of best practices for working across multiple Business Analyst license levels in an ArcGIS organization.
How do I manage users’ licenses in my organization?
An organization’s administrator can assign, reassign, and unassign Business Analyst Web App licenses using their ArcGIS Online organization’s Licenses page. For detailed instructions on multiple use cases, see How to assign Business Analyst licenses to users in your ArcGIS Online organization.
You can also watch a demonstration of the license management process in the following video:https://mediaspace.esri.com/embed/secure/iframe/entryId/1_letxk6je/238781273/uiConfId/49806163
How can users share infographics between license levels?
Infographics are one of the most powerful and popular features in ArcGIS Business Analyst Web App. These visualizations allow the viewer to absorb massive amounts of data about an area of interest in a streamlined and digestible format.
Users with a Standard license can run infographics and reports created by Esri, using popular templates such as Key Facts and Childhood and female equity.

Advanced users have additional capabilities, including the ability to build an infographic template and access the infographic gallery containing bonus templates, such as the Environmental preferences infographic template.

However, Standard license users can also access advanced infographic capabilities through other users in their organization. A user with an Advanced license can help!
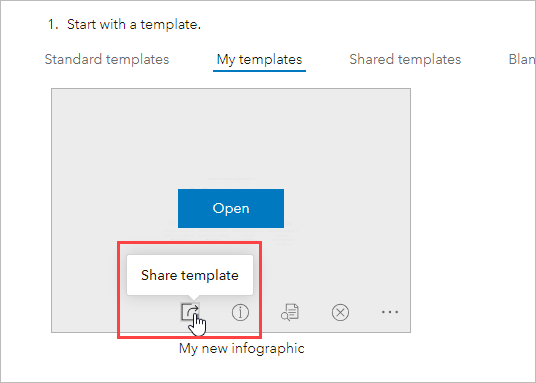
- An Advanced user builds a custom template.

- An Advanced user shares the template with their organization.

- A Standard user can then access and run the custom template.

This is a neat workaround that allows Standard license users to run customized infographics on any area of their choosing.
How can users share custom data between license levels?
Creating custom data is an oft-travelled route for Advanced license Business Analyst Web App users. By importing and setting up their own data, the Advanced user opens a whole new world of custom variables and bespoke data. Why should Standard license users miss out on all the fun and insights?
One way to circumvent this limitation is for an Advanced user to share custom data with users in their organization, including Standard users. This way, members of the organization at any license level can use custom variables through the data browser in many workflows.
- An Advanced user sets up custom data.

- An Advanced user shares custom data with their organization.

- A Standard user can then access and use custom data through the data browser.

Don’t overlook the Data Shared with Me tab in the data browser! This little tab contains multitudes when Advanced users share their custom data.
How can users share analysis results between license levels?
A big draw for Advanced license users is the ability to perform sophisticated analysis using cornerstone Business Analyst workflows: suitability analysis, void analysis, and threshold areas.
Currently, Standard license users can access only one of these analyses when shared by an Advanced license user: threshold areas. To share the threshold areas they have created, an Advanced user can share the whole project containing the analysis, which can then be accessed by other users regardless of license level.
- An Advanced user creates threshold areas.

- An Advanced user shares the project containing the threshold areas with their organization.

- A Standard user can then open the shared project and view the analysis.

In terms of sharing a suitability analysis or void analysis, it’s not currently possible to share the actual analyses between license levels (though we’re working on it!). You can, however, share the results of these workflows—as an Excel file for suitability analysis and as a PDF file for void analysis. Not too shabby!
How can users share dashboards and stories between license levels?
Another, sometimes-overlooked way of sharing work between license levels in Business Analyst is the option of creating a dashboard or story that disseminates your sites, maps, and infographics.
Users with an Advanced license can create a story or create a dashboard and follow the workflow instructions to create shareable links, then send them to Standard license users.

Stay tuned, as the Business Analyst team is working on new ways of sharing content—including advanced analysis features—between license levels.
Banner image created using Canva.
