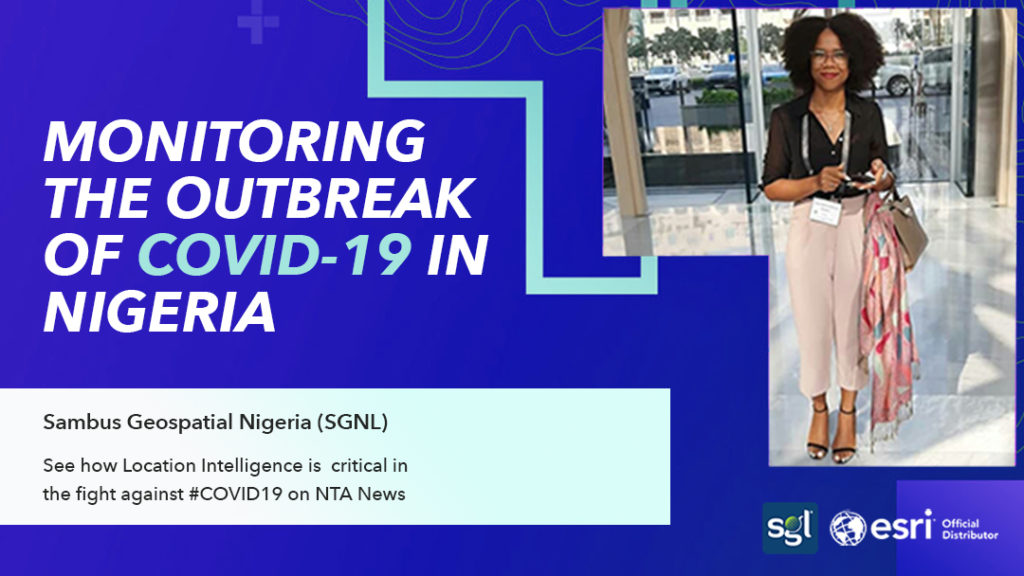
Briefing NTA on COVID-19 Monitoring
SGNL briefs NTA on COVID-19 Tracking Dashboards
In a media briefing, Sambus Geospatial Nigeria Limited, the official distributors of ArcGIS software and an application development firm that provides a range of geospatial solutions in Nigeria tells the Nigerian Television Authority, NTA Channel5 News about how cases of COVID-19 is tracked using a data visualization platform known as the operational dashboard for ArcGIS.

The operational dashboard is designed to strategically visualize and monitor the spread of coronavirus over time. The dashboard covers some of the West African nations showing the infected and prone areas. The dashboard provides a well soured authoritative information that is readily available for prompt and informed response to current and potential impacts of COVID-19.
Esther Moore, the team manager of the Sambus Geospatial Nigeria, noted in the media briefing, “what we have done is… to use the information from NCDC -The Nigerian Centre for Disease Control and the information we have on the Isolation Centres, plug it into our GIS software to create an operations dashboard, so it shows you the spread of the virus… ”
West Africa's COVID19 operational dashboard for ArcGIS designed by Sambus Geospatial Nigeria Limited
Monitoring the Spread
The spread of Covid19 in Nigeria just like in any affected nation has no separate story from the scramble for a solution while numbers continue to rise. As the Nigerian government engages its citizens in all safety measures in an attempt to contain the spread in the absence of a vaccine, other West African countries are also not in the exception.
Sambus West African Covid19 dashboard is created to support this effort by the government and other key players with current information using the science of geography to enhance government decisions.
Active and Recovered Cases
The dashboard shows the number of active and improved cases and maps out the locations where these cases are found. The purpose of this is to get the people updated with the information about the latest development as they are announced by the health authorities. The government can also use this information to target interventions.
The lights in the dashboard explain the occurrences, the green light shows the recovered cases, the yellow light represents the active cases, while the red light shows the number of deaths in each of the regions covered in the dashboard.
Currently, as of 23rd of April 2020, the most occurrence in Nigeria is found in Lagos city with 309 active cases, followed by the Federal Capital Territory, Abuja reporting 80 active cases. This representation can be used for instance to plan better emergency response with much focus on the highly infected communities in Lagos and Abuja.
The complementary dashboard is updated daily and it is easy to use in all device forms, available in both desktop and mobile screen sizes. Visit Sambus COVID-19 Hub to access our mapping resources today.
