What’s new in Business Analyst Mobile | March 2024
The first release of ArcGIS Business Analyst Mobile App in 2024 is available! For iOS users, the updated app is available in the Apple App Store, and likewise, the update to the Android version is available in the Google Play Store.
This release features two enhancements:
- You can now use the Business Analyst Mobile App to view facts, comparisons, infographics and classic reports for polygon and point features from web maps.
- You can now export infographics from Business Analyst Mobile App in PDF format.
The next two sections take a closer look at these enhancements, and also include embedded links to relevant sections of the help documentation where you can find additional information.
View Facts, Comparisons, Infographics and Classic Reports for Web Map features
You can browse available web maps in Business Analyst Mobile App, by tapping Menu options and then tapping ArcGIS. On this screen, you can perform a keyword search for web maps, or view web maps available under any of the categories, such as Favorites, Living Atlas, or your organization.
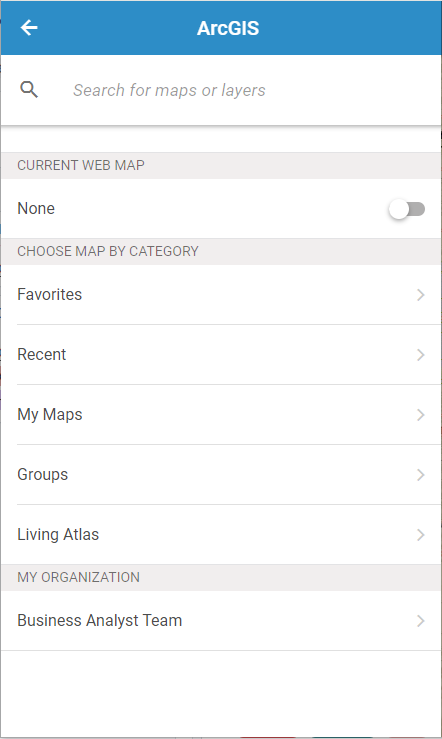
When you select a web map, it will load on the map. You can pan and zoom the map to an area of interest. Web maps may have polygon features, point features, or both.
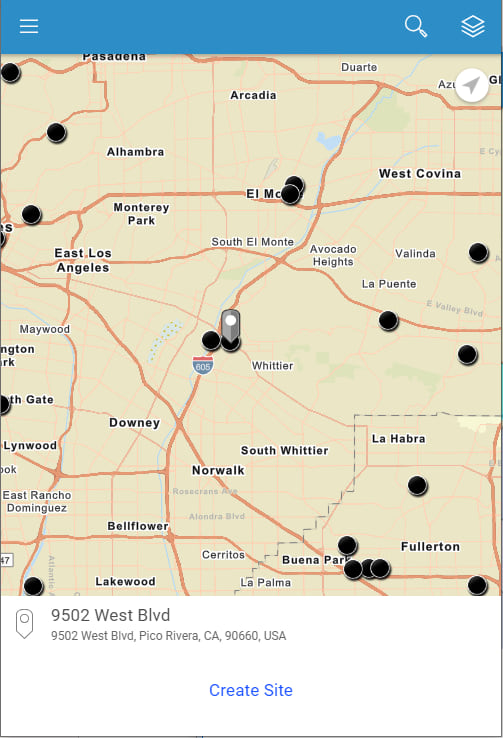
We now come to the new capability available to you: tap on a feature from the web map to select it. If you select a point feature, it will be indicated by a pin symbol. For example, in the following screen capture, the point feature at 9502 West Blvd is selected. Use Create Site to apply rings, drive times, or walk times around the point.
If you selected a polygon feature, it will be highlighted on the map and the feature name will appear in the Site information section of the screen – for example, Irvine city in the following screen capture:
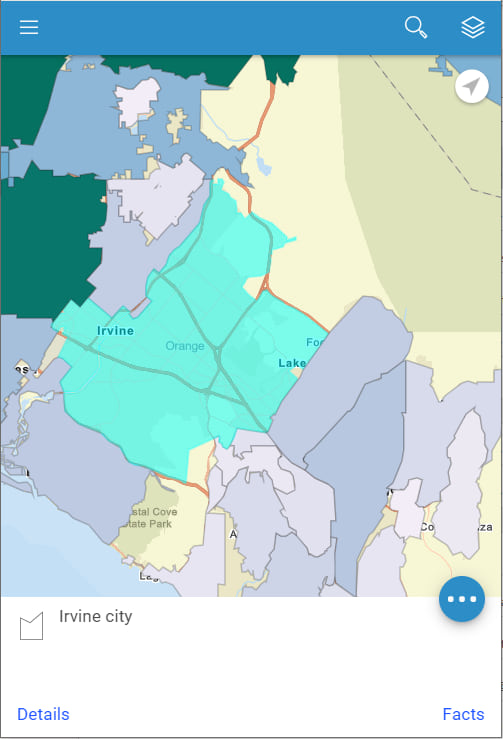
Tip: If your web map has both point and polygon feature layers, the point features may make it difficult to tap on the underlying polygon features. You can use the Map options button to remove the points layer.
All right! For your selected web map feature you will now have all the applicable site options available:
- Tap Facts to view facts.
Tap Site options for the following options:
- For a point location-based site, tap Edit Site to edit it.
- To compare with a geographic boundary or another site, tap Compare.
- To run classic reports, tap Run Reports and use the Classic Reports tab.
- To run infographics, tap Run Reports and use the Infographics tab.
The last of these options brings us to the other new capability now available in the Business Analyst Mobile App, which you can read about in the following section.
Export Infographics in PDF format
In previous versions of the Business Analyst Mobile App, you have been able to run infographics for sites in your project, and with this release, infographics can also be run on polygon features from web maps and sites created from point features in web maps.
To run an infographic, tap Site options and then tap Run Reports to open the Reports screen. On the Infographics tab, you can view the available infographics under any of the subcategories. For example, you can tap Esri Infographics and run the Demographic Profile infographic. The new export button is in the top right of the infographic, indicated by the green boundary around it in this screen capture:
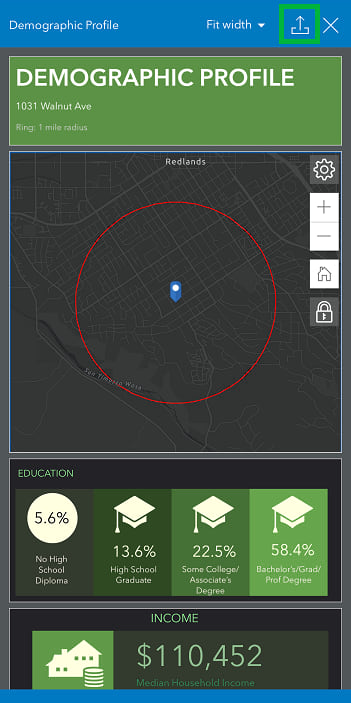
When you tap the Export button, the Export Infographic window opens.
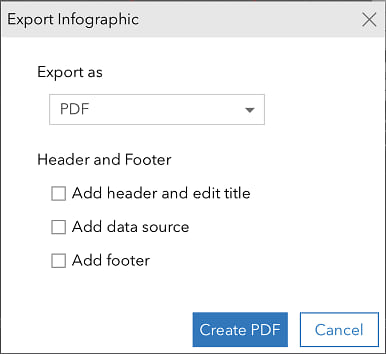
You have the option to select the checkboxes to:
- Add a header or edit the title of the infographic in the exported PDF.
- Add data source information.
- Add a footer.
Note that some of the Esri infographics already include the data source and some of the footer information in the infographic template itself, and it is recommended to consider that to avoid duplicated information in the exported PDF.
When you’re ready, tap Create PDF to generate the PDF file for the infographic. You can save the PDF to your mobile device or share it by email or other means.
Note: Exporting an infographic uses 10 credits.
When you run infographics on a mobile device, they are displayed in the stack mode by default for optimized viewing on a mobile device. However, when you export to PDF, it is saved in full-page mode. If you want to learn more about all the different infographic display modes, this blog article has more details.
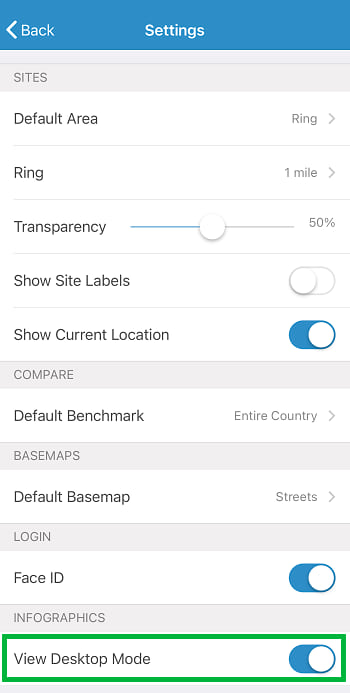
Are you using Business Analyst Mobile App on a tablet or other device with a screen that is large enough that you would prefer to view infographics in full-page mode instead? Here’s a tip: you can enable that by turning on the View Desktop Mode toggle under Settings:
The Business Analyst team hopes that these enhancements make the Business Analyst Mobile App more useful to you as a companion to the Business Analyst Web App. Please share your thoughts by commenting on this article. You can also use the Send Feedback option available within the Business Analyst Mobile App.