GIS and World Cup 2022
The geographic information system (GIS) is a system that creates, manages, analyzes, and is employed to map world cup data. GIS connects championship data to a map, integrating location data (players’ country, club) and all types of descriptive information (players’ age). GIS helps users understand patterns, relationships, and geographic context. The benefits include improved communication and efficiency as well as better management and decision-making.
ArcGIS Dashboards and World Cup
ArcGIS Dashboards enable users to convey information by presenting location-based analytics using intuitive and interactive data visualizations on a single. This can be tailored to World Cup activity, giving the viewers ability to slice the data to get the answers needed. Dashboards are essential information products, like maps and apps, providing a critical component to geospatial infrastructure. In other words, Esri’s dashboard is an important platform that integrates into one place maps, statistics, and information for all participants in the Qatar world cup competition.
Data Visualization of World Cup 2022 Players

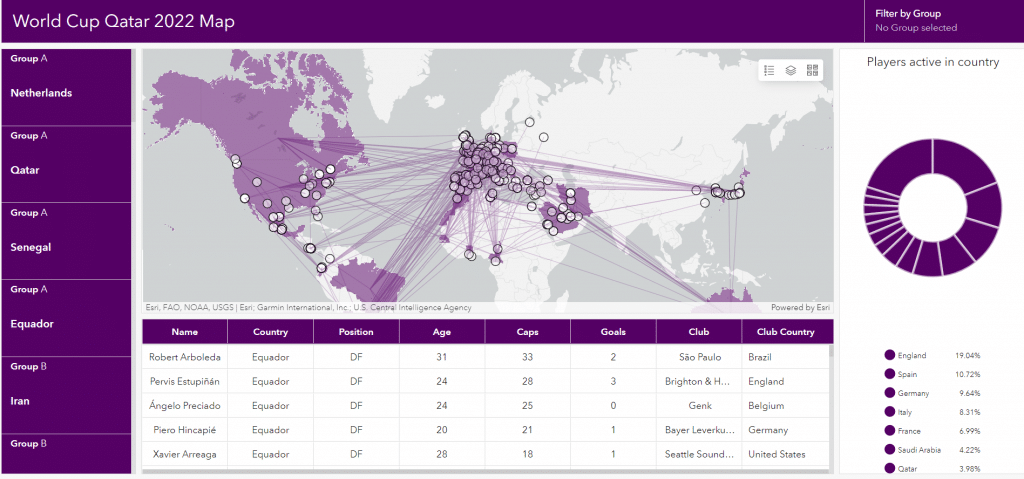
The ArcGIS dashboard illustrates that most players in the championship (158 players or 19.04% of all) play for clubs in England, which is almost twice as many as the representatives of the second country (Spain) in the ranking according to this criterion. For Senegal, none of the players in the squad play for a club in their home country, while all of the host nation’s internationals compete for Qatari clubs. This also shows who is the youngest player in this championship with the most goals scored so far in his career.
Web dashboards answers Tournament/Players related questions
The web dashboard created by Esri provides an answer to many questions on GIS application to Qatar World Cup 2022. It is an interactive map with related charts and statistics, having all the information about the players and teams in the competition is available to view. Reference can be made easily on each player, including their age, origin, club, and country they compete for, the number of goals scored. In addition, the dashboard also makes it possible to view the information having the option to choose a base map of choice.
More Information
Visit Esri Blog to read more.
Source: ESRI Bulgaria 2022, Esri, accessed 10 December 2022, <Esri Blog>