DevSummit Showcases Powerful Tools for Visualization and Data Science
An audience of more than 6,000 livestream and Facebook viewers watched the virtual Plenary Session of the 2020 Esri Developer Summit (DevSummit) on March 10. The event was changed to an online format in response to the global coronavirus disease 2019 (COVID-19) pandemic.
2020 Esri DevSummit
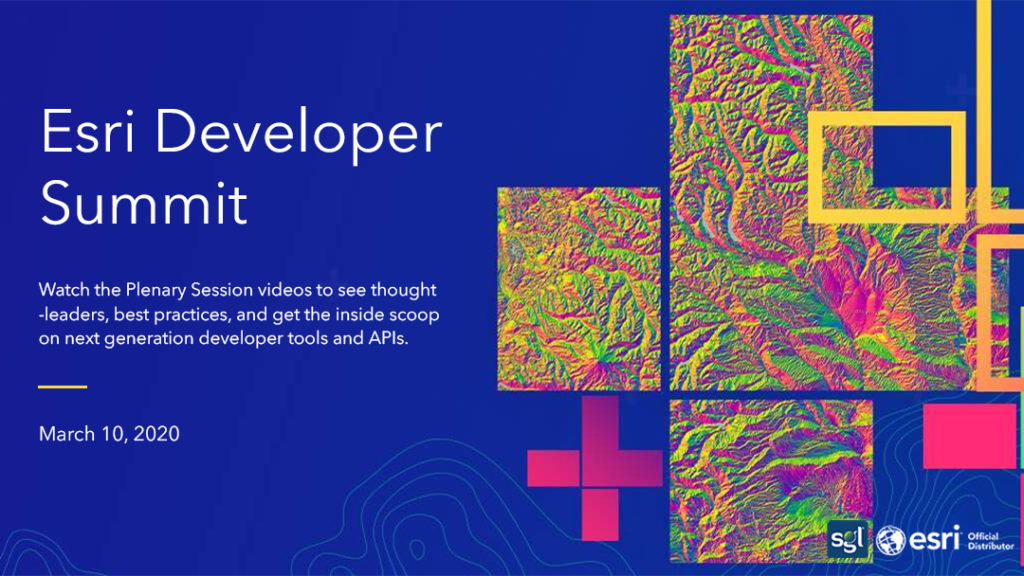
The 2020 Esri Developer Summit (DevSummit) was changed to an online format in response to the global coronavirus disease 2019 (COVID-19) pandemic. This ArcGIS StoryMap map describes the events and shares videos that highlight the technology advances announced during the Plenary session on March 10 and select technical presentations.
This was the 15th annual event “for developers, by developers.” Jim McKinney, chief technology officer for ArcGIS Desktop and Esri president Jack Dangermond opened the session. Dangermond noted that the work of developers is creating “a digital transformation using geographic science.”
Following an overview of the ArcGIS platform by Esri director of software development Sud Menon, more than 25 of Esri’s development staff gave presentations that highlighted improvements in data exploration and visualization, the incorporation of real-time data, the application of data science techniques, better scalability, more automated workflows, and an enhanced developer experience.
More Ways to Make Data Meaningful
The ArcGIS API for JavaScript was featured in several presentations. Its enhanced capabilities, which are reflected in the ArcGIS Online Map Viewer beta, can be used by developers to make amazing maps through dynamic and data-driven styling. Updating the API for modern browsers means developers can build fast and powerful interactive apps for data exploration and visualization.
Furnishing information from data rapidly in a readily comprehensible fashion was the theme of a presentation on the new ArcGIS Dashboards. Dashboards have become tremendously popular as a tool for communicating with executives and the public. Using charts, indicators, and gauges, dashboards can summarize complex datasets, presenting information simply. ArcGIS Arcade can now be used in ArcGIS Dashboards to provide more control over display and calculations.
The ArcGIS Runtime SDKs are engineered so developers can build field apps for gathering data from the field that feeds dashboards and visualizations. New releases of the ArcGIS Runtime support apps that can work offline or function with intermittent connectivity and employ strategies that take the load off the server
Watch the Plenary here: 2020 Esri DevSummit Plenary.

