Spatial Analysis of Land Use land Cover of Etsako West LGA of Edo State Nigeria
Through a process called image classification, remote sensing is one of the most important tools for the production of land use and land cover maps. Several factors should be considered for the image classification process to be successful, including the availability of high-quality Landsat imagery and secondary data, a precise classification process, and the user’s experience and expertise with the procedures. The goal of this study was to use remote sensing and GIS techniques to classify and map land-use/land-cover in the study area.
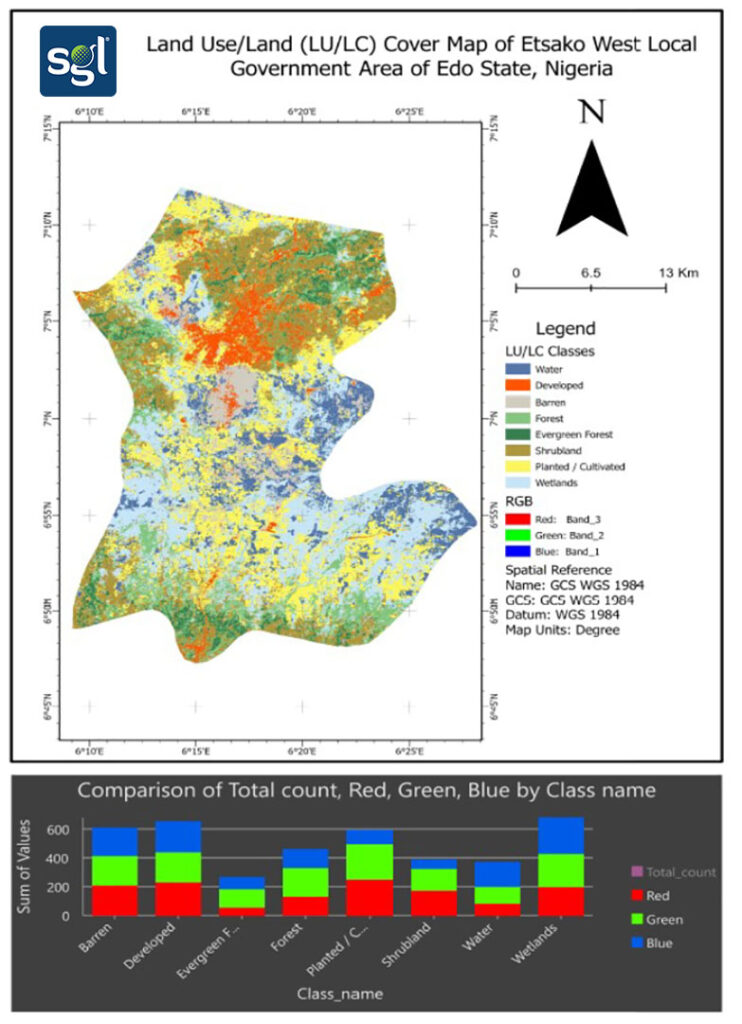
This study is divided into two sections: (1) classification of landuse/landcover (LULC) and (2) accuracy assessment. The Non-Parametric rule was used to perform supervised classification in this study. Wetlands (23 %), water bodies (11 %), and developed areas (5 %) were the most common LULC types, followed by evergreen forest (5 %), shrublands (18 %), and barren land (6 %), Cultivated/planted (22 %), and Forest (22 percent) (10 %). The overall classification accuracy of the study was 81.7 %, with a kappa coefficient (K) of 0.722. The kappa coefficient is significant, indicating that the classified image is suitable for further investigation. This study presents an essential source of information whereby planners and decision-makers can use to sustainably plan the environment
Land use land cover mapping
Land cover data shows how much forest, wetlands, impervious surfaces, agriculture, and other land and water types cover a region. Wetlands and open water are examples of different types of water. The term “land use” refers to how people use the landscape, whether for development, conservation, or a combination of the two. Different types of land cover can be managed and used in a variety of ways.
Satellite and aerial imagery can be used to determine land cover. Satellite imagery cannot be used to determine land use. Land cover maps provide data that managers can use to better understand the current landscape. Land cover maps from several years are required to see changes over time.
Although the terms land cover and land use are frequently used interchangeably, they have very different meanings. The surface cover on the ground, whether it is vegetation, urban infrastructure, water, bare soil, or something else, is referred to as land cover.
For global monitoring studies, resource management, and planning activities, identifying, delineating, and mapping land cover is critical. Land cover identification establishes a baseline from which monitoring activities (change detection) can be carried out, as well as providing ground cover data for baseline thematic maps.
It’s crucial to understand the difference between land cover and land use, as well as the information that each can provide. Remote sensing properties relate to land cover, from which land use can be inferred, especially with ancillary data or a priori knowledge. Land cover/use studies are multidisciplinary in nature, so the participants range from international wildlife and conservation foundations to government researchers and forestry companies. Land cover inventory and land use monitoring are operational needs for regional (and state) government agencies in Nigeria.
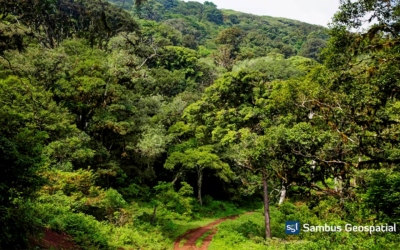
The Study area:
Etsako West is a Local Government Area of Edo State, Nigeria. Its headquarters are in the town of Auchi. Etsako West is made up of six clans: Uzairue, Auchi, South Ibie, Anwain, Jagbe and Aviele. The major towns in this LGA include Auchi, Jattu, Agbede, Ughiole, Iyamho, Iyuku, Ayogwiri, Apana, Iyora, Afowa, Afashio, Ikabigbo, Irekpai, Ogbido, Ayaoghena, Ikholo, Uluoke, Ugbhenor, Idato, Ayua, Imeke, Elele, Sabo Iyakpi, Ibienafe, Ughieda, Iyerekhu, Egbogio, Jagbe clan (Ikhwa, Imiokono, Inhianmhen, Imogian) and Awain clan {Ewora, Idegun, Ama, Ibhioba}.
The Agbedes were originally the makers of the artifacts that are seen in Benin. There was a threatened elimination of the Agbedes in Benin, which led to the evacuation of the Agbede people from the Benin Kingdom.
Methodology:
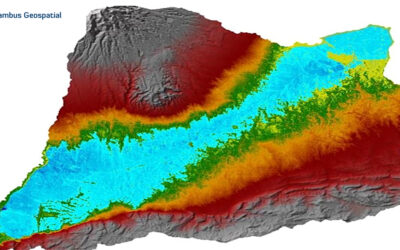
Landsat 8 satellite image was downloaded from glovis (https://glovis.usgs.gov/). The satellite image bands 5 4,3 representing the Near infrared, Red, and the Green band respectively were used to pro-cess the Imagery to analyze land use cover of the study area.
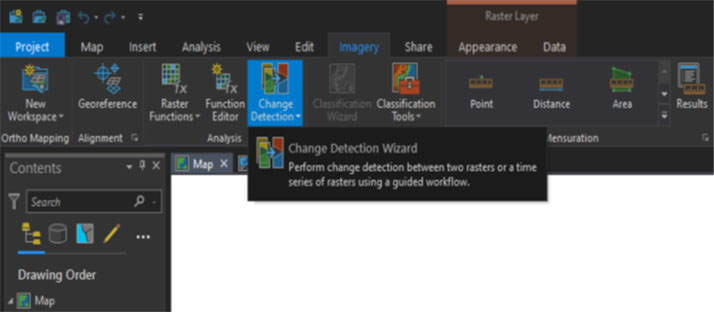
The ArcGIS pro Change detection analysis toolbox from the Raster Layer tab was used to process the satellite imagery. The satellite bands were inputted into the change detection wizard which was processed via the supervised classification module.
Project by : Tesini Precious Dombo tdombo@sambusgeospatial.com
Contribution: Bamidele clement Oke boke@sambusgeospatial.com
Software : ArcGIS Pro 2.7.2
Data Source : https://glovis.usgs.gov/