Site Suitability Analysis for Rice Production in Katchia LGA, Niger State, Nigeria
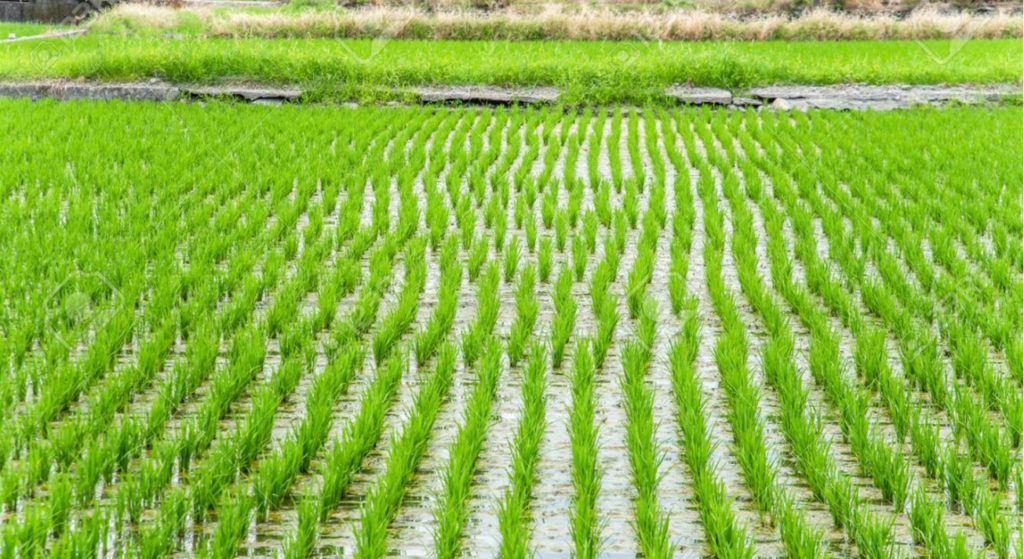
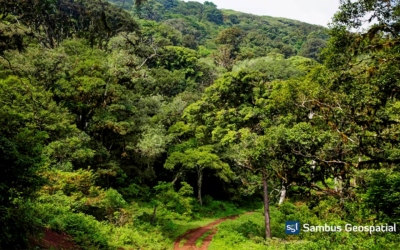
Rice is a seed of the monocot plants Oryza Sativa (Asian rice) or Oryza Glaberrima (African rice). As a cereal grain, it is the most widely consumed staple food for a large part of the world’s human population, especially in Asia. It is the agricultural commodity with the third-highest worldwide production, after sugarcane and maize, according to data of FAOSTAT 2012.
Since a large portion of maize crops are grown for a purpose other than human consumption, rice is the most important grain with regards to human nutrient and caloric intake, providing more than one-fifth of the calories consumed worldwide by humans.
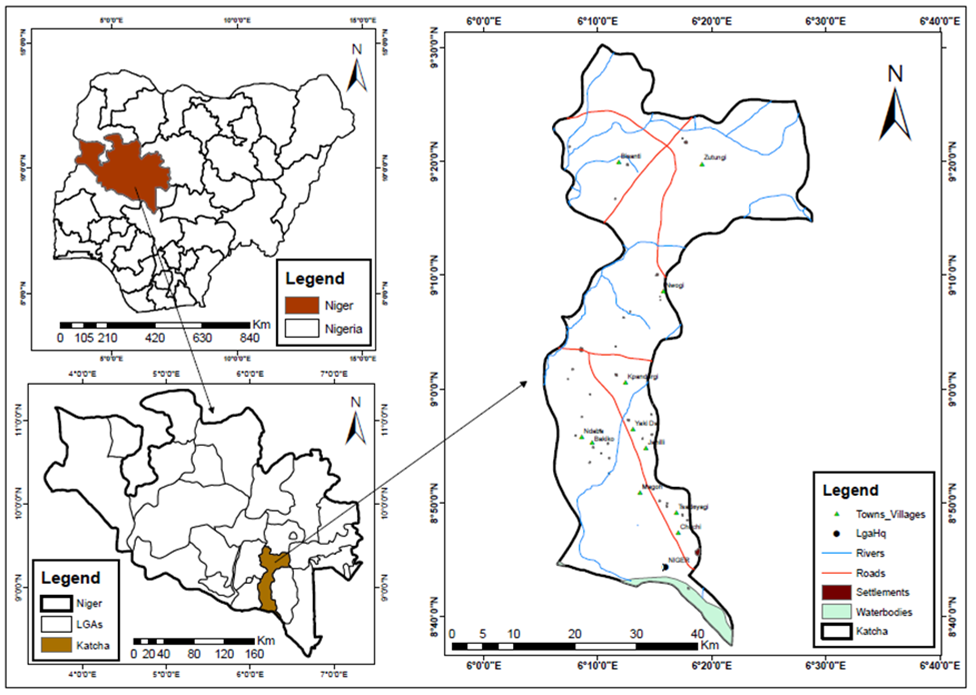
Bida/Katcha Local Government is one of the fastest-growing areas in Niger state Nigeria due to its political, traditional, and historical status as the home city of the Nupe’s as well as its geographical location.
As a result, this has led to a large and steady influx of people from all over the nation. Hence, the emergence as well as the growth of settlements in the territory without a considerable increase in food production. The development in settlements and the population growth have been increasing the human demand for land as well as an increase in the demand for food crops like rice, maize among others.
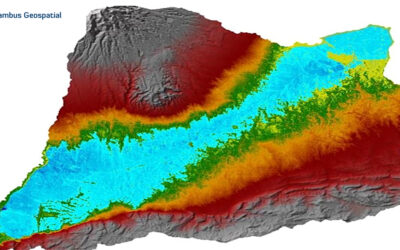
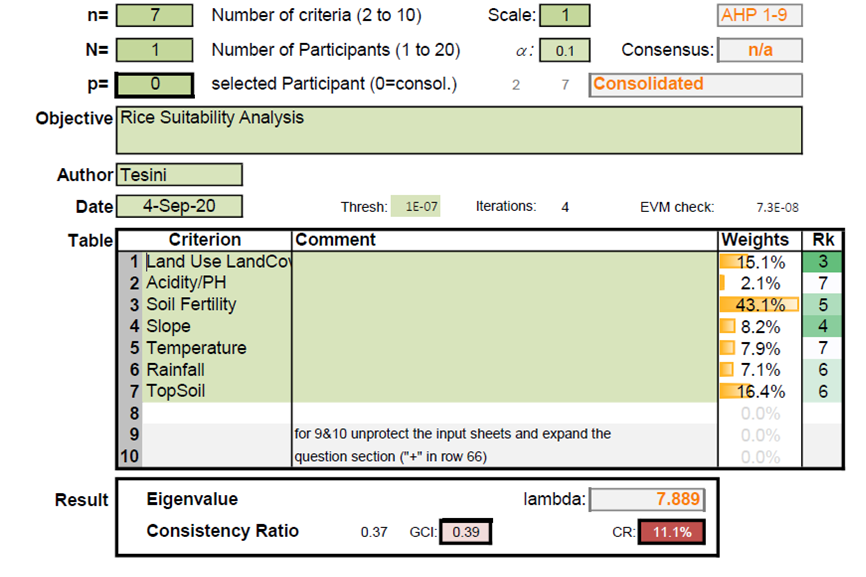
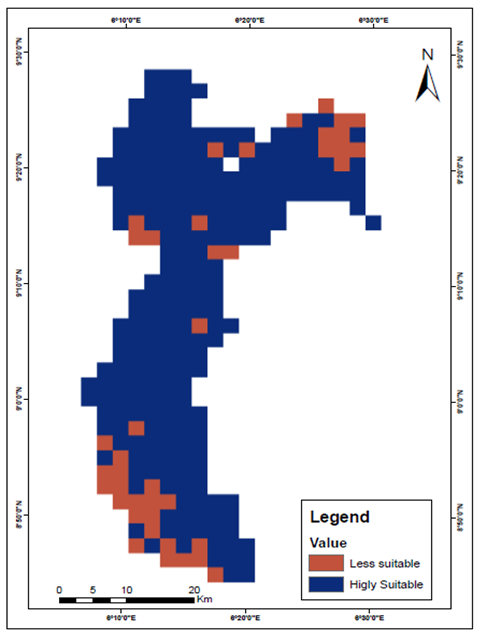
This research explores the use of GIS to identify suitable areas for growing rice in BIDA/KATCHA Local Government, Niger State. This was achieved by overlaying spatial map layers of the various parameters affecting the growth of rice; temperature, rainfall, altitude, soil PH, soil drainage, and soil texture.
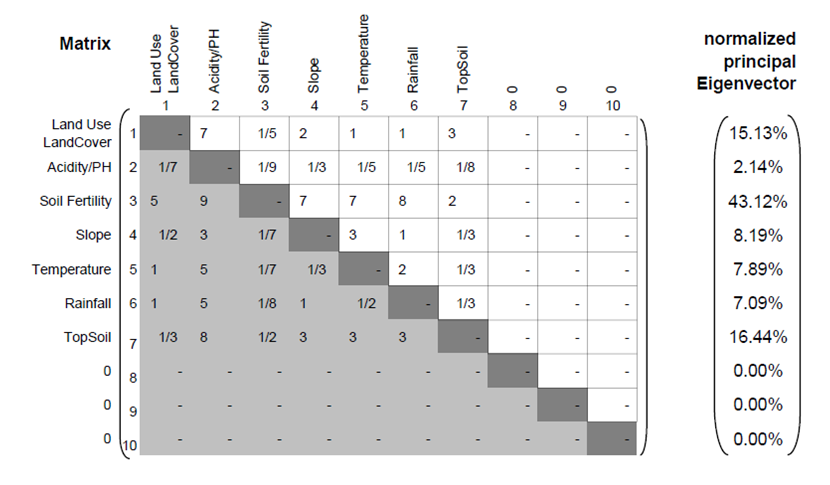
The model builder gives the best integration of programming workflows and visualization of the data analysis processes in ArcGIS. It is the most simplified approach that enhances visual impression, understands the ability of workflows and actual data analysis. Furthermore, the Analytical hierarchy process was used in weighting factors/ parameters used in the suitability analysis.
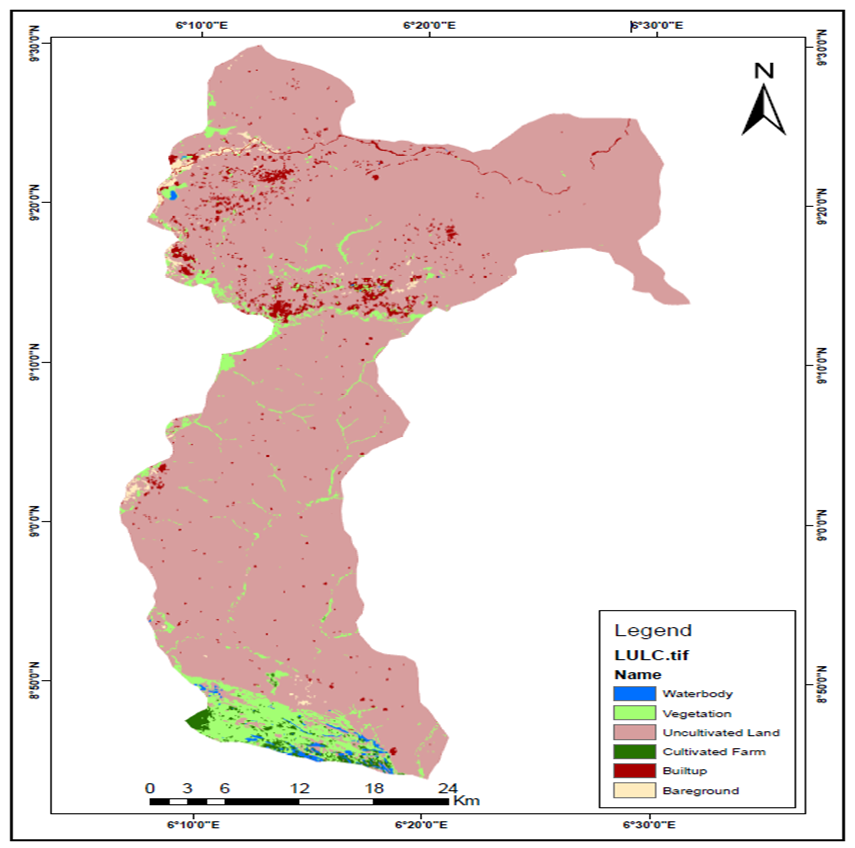
| S/N | Land Use | Area KM2 | Percentage |
| 1 | Vegetation | 98.3665 | 5.845559 |
| 2 | Cultivated | 13.0392 | 0.774872 |
| 3 | Waterbody | 7.9425 | 0.471994 |
| 4 | Builtup | 42.9453 | 2.552081 |
| 5 | Uncultivated | 1508.895 | 89.66807 |
| 6 | Bare ground | 11.5677 | 0.687426 |
| Total | 1682.756 | 100 |
| Overall Accuracy | 0.9125 |
| Kappa | 0.8965 |
| Omission | PERCENTAGE | |
| Omission | Percent | |
| Vegetation | 8 | 0.2 |
| Cultivated | 6 | 0.15 |
| Waterbody | 2 | 0.05 |
| Builtup | 5 | 0.125 |
| Uncultivated | 0 | 0 |
| Bare ground | 0 | 0 |
| Producers accuracy | ||
| Producer Accuracy | ||
| Vegetation | 40 | 100 |
| Cultivated | 40 | 100 |
| Waterbody | 35 | 87.5 |
| Builtup | 38 | 95 |
| Uncultivated | 36 | 90 |
| Bare ground | 30 | 75 |
| Users Accuracy | ||
| User Accuracy | ||
| Vegetation | 40 | 83.33333 |
| Cultivated | 40 | 86.95652 |
| Waterbody | 35 | 94.59459 |
| Builtup | 38 | 88.37209 |
| Uncultivated | 36 | 100 |
| Bare ground | 30 | 100 |
For more information contact contributors :
Tesini P. Dombo: tdombo@sambusgeospatial.com
Taofeek Adebayo: tadebayo@sambusgeospatial.com
SOFTWARE: ArcGIS Desktop 10.8, AHP Calculator
DATA SOURCES: USGS: Landsat 8 OLI, DEM, OSGOF Nigeria and Federal Ministry of Agriculture Nigeria.