Combating Crime in Nigeria using GIS
The #ENDSARS protest in Nigeria began as a demand for Justice but escalated into a nationwide if not a global concern. The youth claimed that officers responsible for some unlawful killings haven’t been brought to justice.
Most crisis communication experts agree that “transparency is key to maintaining or retaining the public’s trust”.
Adequate data collection and analysis tools, in matters like this, are similar to the oil poured into troubled waters. As the Nigerian Police force continues to make changes to both strengthen and reform their organization, much attention should be paid to the intelligence department in creating a means of monitoring the activities of the police force.
For instance, with the aid of body cameras and communication devices to the various unit during daily operations and activities, these devices can be integrated with field data collection tools to support easy and swift data collection process and visualization with the aid of Web/Organization dashboards.
With adequate utilization of tools and facilities issues like this can be handled. As the world keeps advancing in technology, there’s a need for every sector in the nation to follow suit.
Also, GIS does not replace a law enforcement agency’s process of collecting and storing information in a database. Rather, it enhances the agency’s ability to use the data, spatially visualize and spatially analyze the data for decision making, investigation process and spatially monitoring offenders, etc.
Crime Dimensions
There are four dimensions to a crime: A legal crime which deals laws being broken, the Victimized crime which targets an individual or a group of people, the crime that has only one offender responsible and the spatial crime which references a specific place and time.
With an adequate geographic information system platform, data can be integrated with ease. That’s why it is necessary that Law enforcement in Nigeria collaborate with different agencies holding different citizen’s data. Data from agencies like the National Population Commission (NPC), National Bureau of Statistics (NBS), National Identification and Management Commission (NIMC), National Communication Commission (NCC) can be integrated into the law enforcement database to make operations easier, especially in times where cyber crimes are common.
If need be, data can be obtained from even the transport agencies, to query the travel history of offenders, the crime pattern in Nigeria, how they have moved and why they have moved. This would give the law enforcement insight into decisions to make. Data queried from the national identity commissions can be also used to ascertain if truly a suspected offender is a citizen of Nigeria which gives more insight on how to approach such crimes. In addition to plotting the geographical attributes of criminal phenomena, law enforcement agencies seek answers to why a specific crime occurs in a certain area. It’s no doubt that Crime has an inherent geographical quality.
Using GIS in combating crime can help in Intelligence gathering, Performance review, Crime analysis, Criminal investigations mapping crime hotspots, targeting reassurance, and also Research agendas like Publishing crime statistics to the public/government officials or other stakeholders, Spatial significance, Spatial regression, Modelling and simulation and also Crime prediction.
The various ArcGIS platforms by Esri (Survey123, workforce, ArcGIS Dashboard, etc.) tools do not only support smooth data gathering but with its ability to also provide spatial attributes to the data being gathered. Data can be analyzed, visualized, and presented to portray information to aid easy decision making which leads to a more favorable method for policymaking.
This would also help the NPF differentiate if they are responsible for such crimes or not. With the help of some GIS tools, NPF can determine if such incidents happened when officers were on duty or not. The NPF would be able to come out with substantial evidence to back them up with whatever decision they are to make. To learn more, please read also: Link
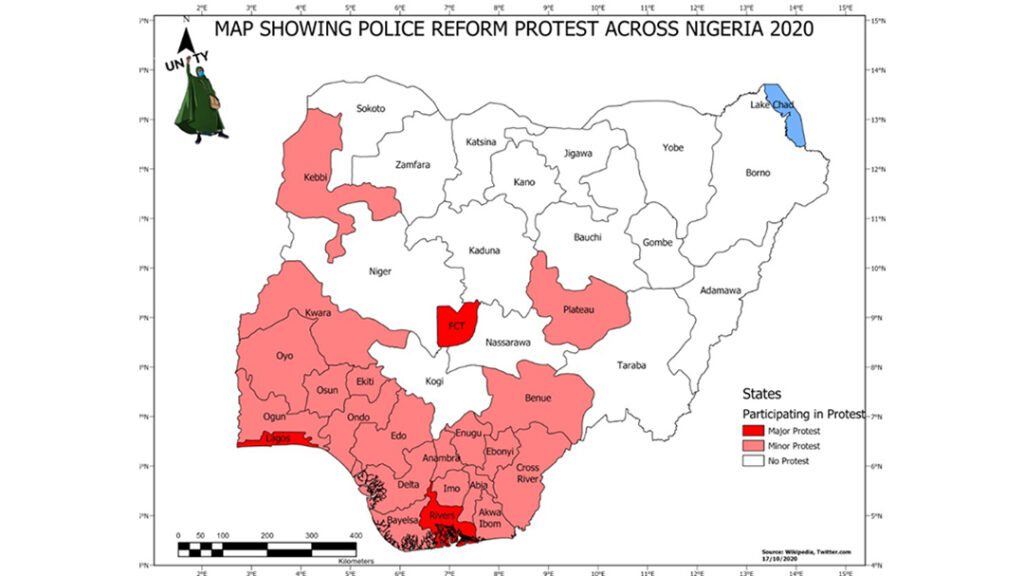
About Map
The above map was created using ArcGIS pro, The data used was gotten from Wikipedia and Twitter using the events hashtags. The research department of different security agencies can use this tool to visualize the effect of such protests and give an insight on how to tackle such events based on priority, and for more complex datasets, machine learning and Deep learning can be used for more predictive analysis
Authored by Mberede Benedict Obinna
Technical Sales| Sambus Geospatial Nigeria Limited