Lebanon Addresses Water Quality Concerns with GIS
Lebanon has faced major challenges including economic and political instability as well as disasters like the explosion at the port of Beirut in 2020. The latter left many residents in poverty and unable to afford necessities including food, clothing, water, and fuel. While the country is working hard to recover and stabilize both financially and politically, Lebanon, like many nations, also faces the threat of climate change—exacerbating recovery efforts. Prolonged periods of higher temperatures stress the country’s water and electricity supply for residents, increasing scarcity of resources.
Key Takeaways:
- In 2021, a UNICEF report highlighted the critical state of Lebanon’s water supply. Researchers implemented GIS technology to address water quality issues and better understand climate change risks.
- The National Council for Scientific Research—Lebanon (CNRS-L) enabled geographic information system (GIS) technology to address fragmented data collection, limited community engagement, and response time to an emergency.
- Implementing GIS fosters stakeholder collaboration and coordination for more effective emergency response efforts.
- Products used in this case study: ArcGIS Online, ArcGIS Collector, ArcGIS Pro
The United Nations Children’s Emergency Fund (UNICEF) reported in 2021 that Lebanon’s water supply was on the verge of collapse. The report warned that more than 71 per cent of residents fall into the highly critical and critical levels of vulnerability. To combat the negative impacts of climate change, specifically with water quality management, the National Council for Scientific Research—Lebanon (CNRS-L), utilizes scientific research to predict meteorological hazards, support emergency operations, and forecast winter storms and heat waves.
CNRS-L collaborates with a variety of government agencies and nongovernmental agencies to support this work. The newly established national early warning system of CNRS-L plays a crucial role in identifying potential water quality issues along the coast of Lebanon. This system utilizes geographic information system (GIS) technology, allowing CRNS-L staff and stakeholders real-time access to data, promoting transparency and awareness among the public, implementing targeted public health measures, and safeguarding the marine environment.
Improved Data Collection, Sharing, and Community Engagement
Previously, data collection efforts were fragmented and often paper-based, time-consuming and inefficient. Community engagement in matters of water management was also limited. However, the adoption of GIS technology, specifically ArcGIS Online, ArcGIS Pro, and ArcGIS Collector has revolutionized data collection, management, visualization, and sharing. Researchers can now create interactive maps and dashboards. Having one secure repository of data has increased collaboration and allows for the comprehensive simplification of sharing data and evaluating historical data trends for bacteria monitoring where staff can then anticipate seasonal variations or sudden changes in water quality.
Since the implementation of GIS, comprehensive water quality assessments have been conducted along the Lebanese coast, identifying the need to increase the number of water quality monitoring stations from six to 37.
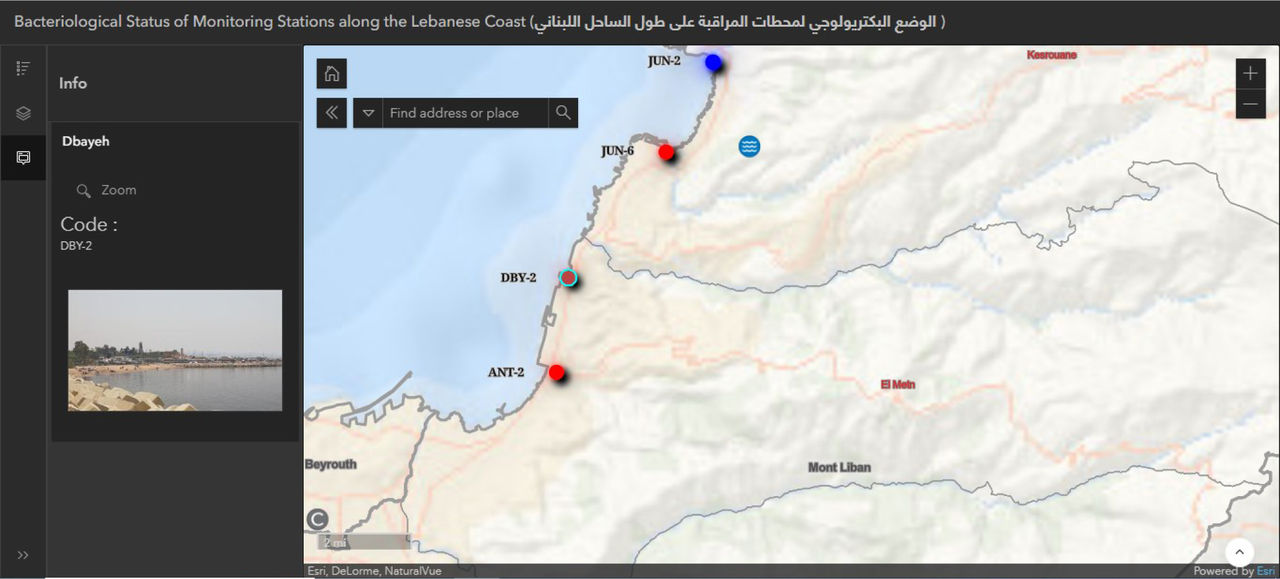 Bacteriological Status of Monitoring Stations along the Lebanese Coast – Zoom into one of the sampling stations
Advanced Monitoring with GIS
These improvements to water quality management help staff and leadership build out greater efficiency in resource allocation and strategic planning efforts. Additionally, the public has access to dashboards that communicate the real-time impact of pollution sources.
Public health departments can also now monitor any sudden contamination events, and quickly identify affected areas, assess the potential extent of contamination, and guide emergency response teams to take appropriate actions. Access to this up-to-date spatial information, all available online through dashboards and web maps, has helped emergency responders to make faster and more informed decisions.
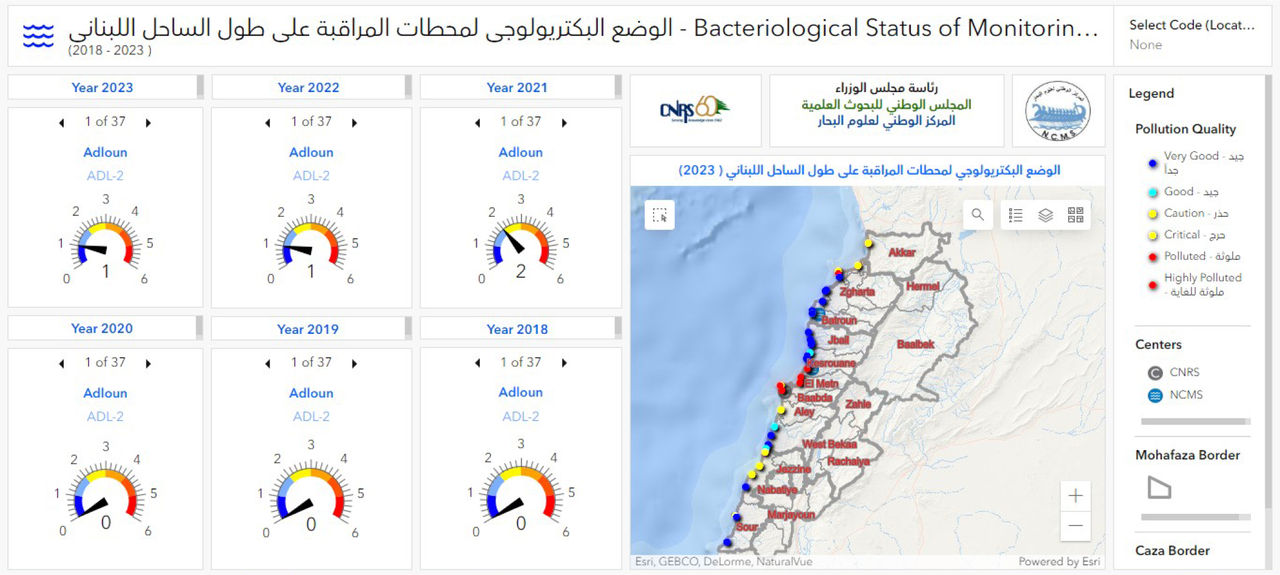 Bacteriological Status of Monitoring Stations along the Lebanese Coast Dashboard (Records from 2018 till 2023)