Automatic Shoreline Delineation Using Geospatial technology
Case Study of Bonny Island
Delineation of Shoreline is a fundamental task practised in different fields for developing setback planning, erosion-accretion studies, hazard zoning, boundary monitoring and predictive modelling of coastal morpho-dynamics.
Shoreline delineation is difficult, time & cost-effective, and sometimes impossible for the entire coastal system when using traditional ground survey techniques. Recently, remote sensing and geographical information system (GIS) techniques and applications are best considered a more simplified method for extracting and delineating shoreline position and detecting shoreline changes.
Study Area
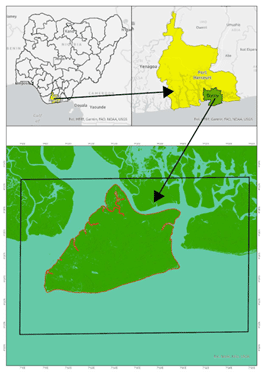
Bonny (originally Ibani) is a traditional coastal town and a Local Government Area in Rivers State, southern Nigeria, on the Bight of Bonny. It is also the capital of the Kingdom of Bonny. Traditionally (especially between the 15th and 19th centuries), it was a major trading post of the eastern Delta, a practice which witnessed the sale of slaves, mainly of Igbo descent. Bonny Island is a major export point for oil.
The region produces a type of crude oil known as Bonny Light oil. Much of the oil extracted onshore in Rivers State is piped to Bonny for export. It has the biggest LNG Gas Plant in Nigeria with six (6) trains. Currently, the Federal Government of Nigeria has set plans for the construction of the 7th train of the NLNG to boost its gas production in anticipation of dominating the African market.
The study area is located at Latitude 4° 26′ 57″ N , and Longitude 7° 14′ 24″ E
Project Focus
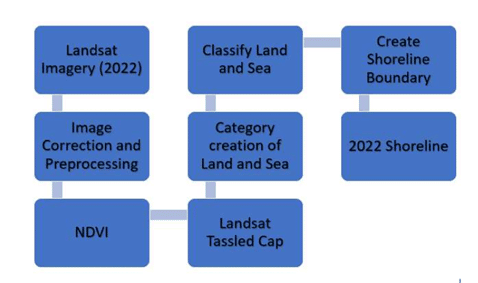
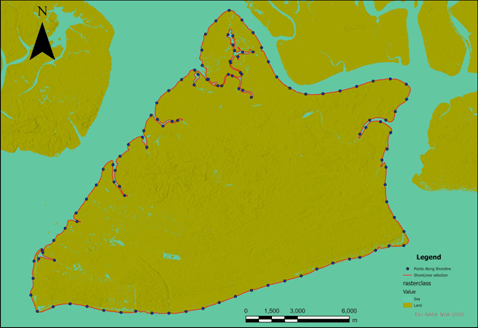
This project focuses on techniques of using the Tasseled Cap and Normalized Difference Vegetation Index (NDVI) approach in ArcGIS Pro to delineate Shoreline automatically.
This approach takes advantage of the fact that land and sea around the coastal zone become distinct and easily identifiable, which helps in the delineation process.
The geoprocessing tools considered during the process are Landsat Tasseled Cap, NDVI, Category Creation for Land and Sea, Classify Land and Sea, and Create Shoreline Boundary.
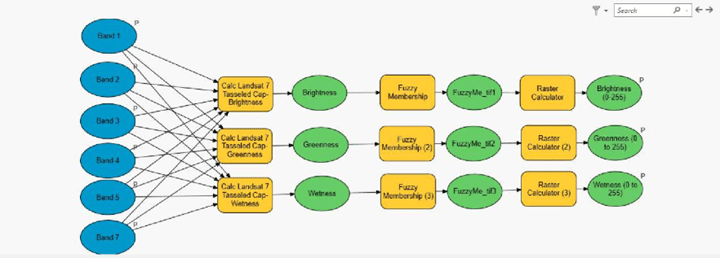
The Tasselled Cap tool is a model which combines some Geoprocessing tools such as the Raster calculator and Fuzzy Membership to generate Wetness, brightness and greenness with the input of the Landsat Bands.
Below also Contains the Model for Classifying Land Sea and Creating Shoreline.
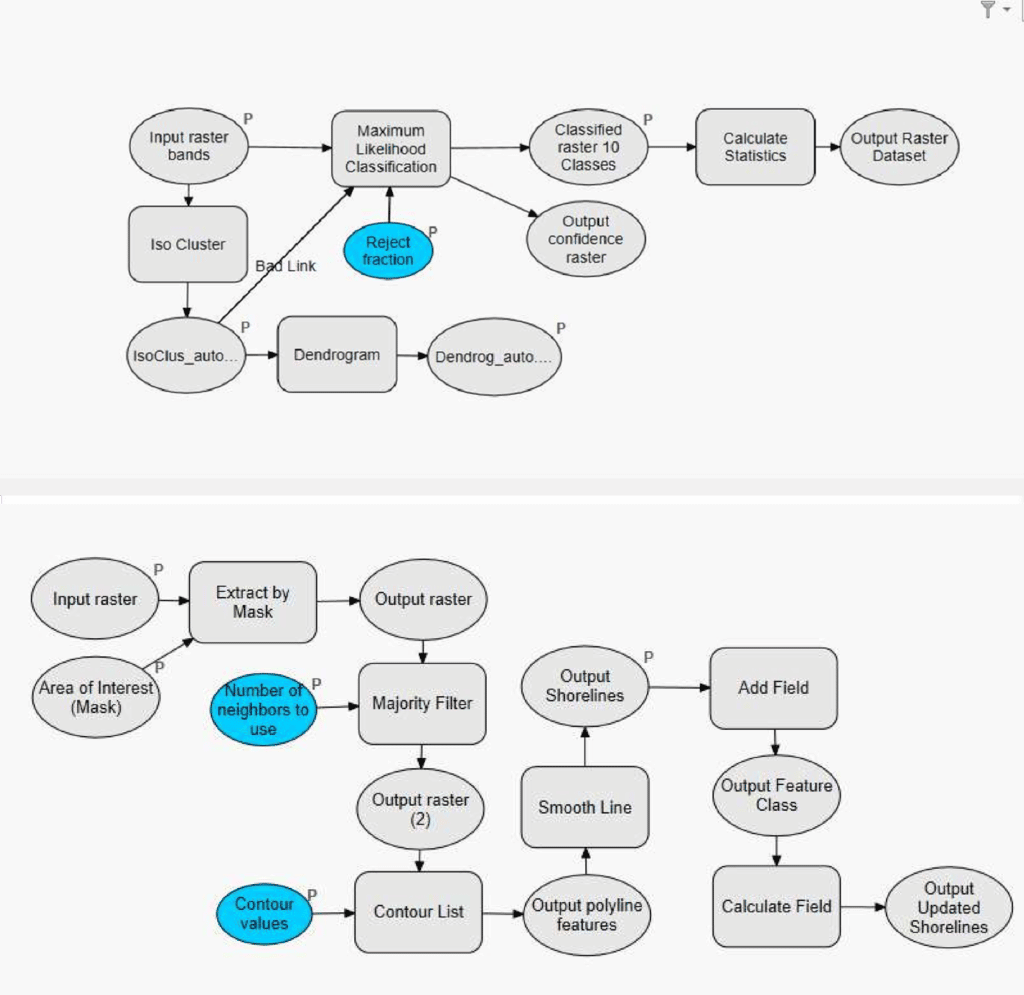
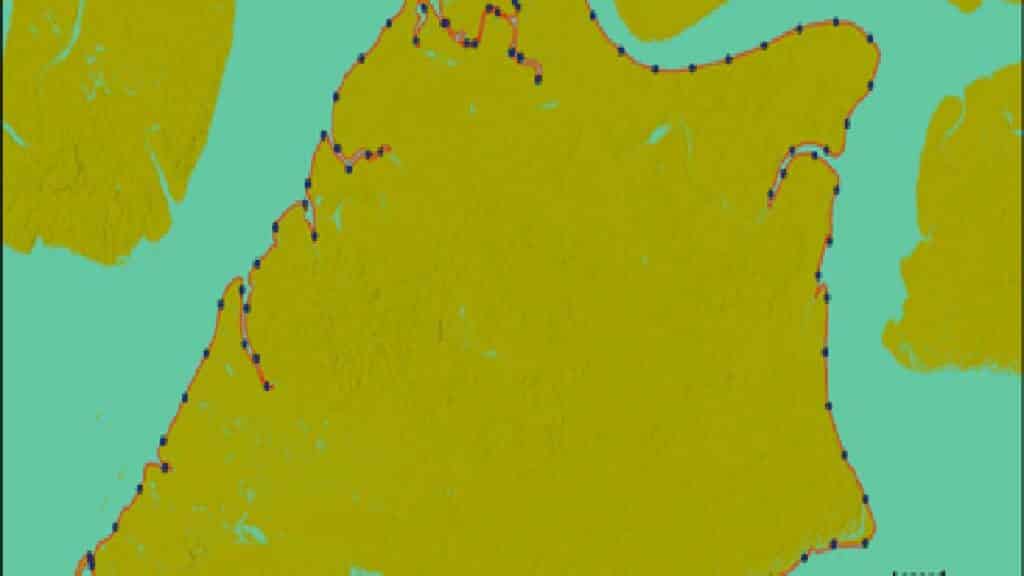
After extracting the Shoreline, the ArcGIS tool for generating points along lines was used to extract points at intervals of 1km. Furthermore, a Geoprocessing analysis was conducted to extract the coordinates of these points to populate the attribute table for any other field activities that would be required.
Conclusion
In conclusion, due to the rigorous process of Shoreline delineation, remote sensing techniques can help extract and delineate Shorelines from different years when using traditional ground survey techniques. This creates spatial-temporal data of shorelines in a study area within a particular season or different seasons of the year for Shoreline monitoring and effects of tidal occurrence in different seasons.
Project by Benedict Obinna Mberede
For more information, send mail to info@sambusgeospatial.com.