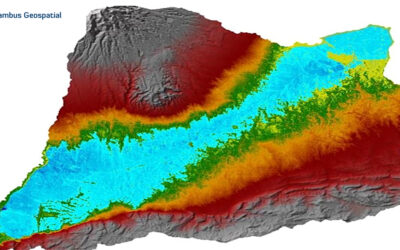
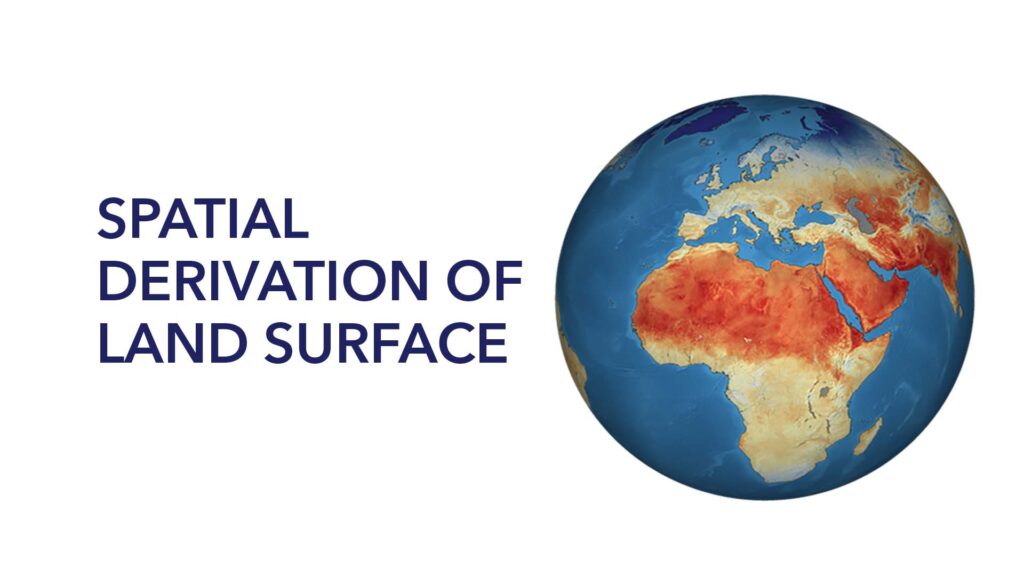
Spatial Derivation of Land Surface Temperature
Land surface temperature is the degree of hotness the “surface” of the earth would feel to the touch in a particular location. From a satellite’s point of view, the “surface” of the earth is whatever it sees when it looks through the atmosphere to the ground. It could be snow and ice, the grass on a lawn, the roof of a building, or the leaves in the canopy of a forest. Thus, the land surface temperature is not the same as the air temperature that is included in the daily weather report.
Scientists monitor land surface temperature because the warmth rising off earth’s landscapes influences (and is influenced by) our world’s weather and climate patterns. Scientists want to monitor how increasing atmospheric greenhouse gases affect land surface temperature and how rising land surface temperatures affect glaciers, ice sheets, permafrost, and the vegetation in the earth’s ecosystems.
Commercial farmers may also use land surface temperature maps to evaluate water requirements for their crops during the summer when they are prone to heat stress. Conversely, these maps can help citrus farmers determine where and when orange groves could have been exposed to damaging frost in winter.
Land Surface Temperature (LST) is a fundamental aspect of climate and biology, affecting organisms and ecosystems from local to global scales. Identified as one of the most essential Earth System Data Records by NASA and other international organizations (King, 1999), LST measures the emission of thermal radiance from the land surface where the incoming solar energy interacts with and heats the ground or the surface of the canopy in vegetated areas. This quality makes LST a good indicator of energy partitioning at the land surface-atmosphere boundary and sensitive to changing surface conditions (Nemani et al., 1996; Wan et al., 2004; Lambin and Ehrlich, 1995; Mildrexler et al., 2009).
The following Formula Below was used to derive the LST:
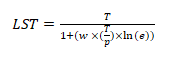
where:
T = Top of atmosphere brightness temperature (K)
w = wavelength of emitted radiance
p = h * c / s (1.438 * 10-2 m K)
h = Planck’s constant (6.626 * 10-34 Js)
s = Boltzmann constant (1.38 * 10-23 J/K)
c = velocity of light (2.998 * 108 m/s)
e = Land surface emissivity (0.004Pv + 0.986)
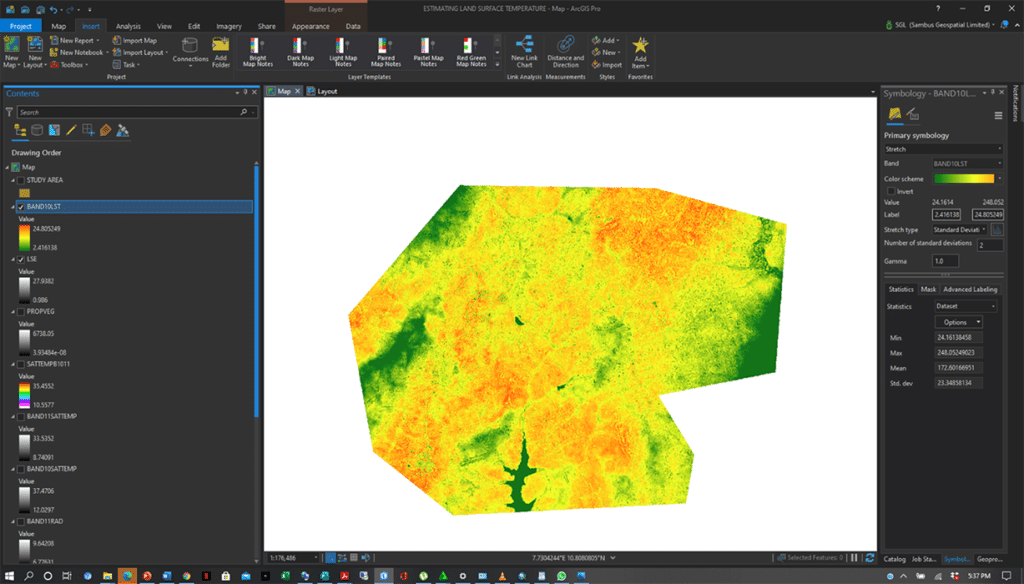
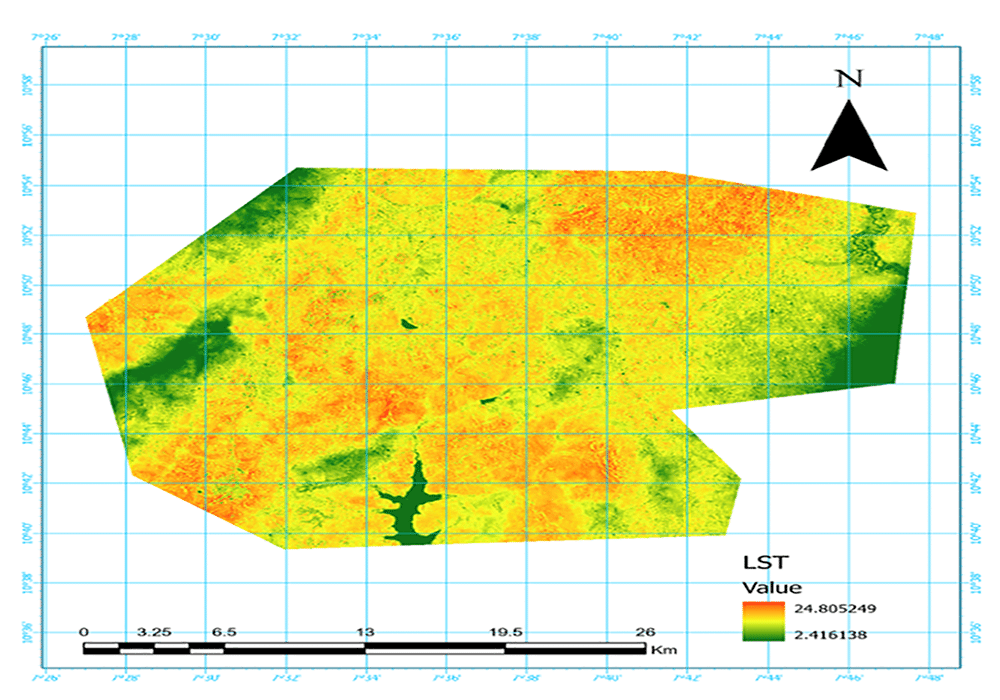
Software: ArcGIS Pro 2.6
Data source: USGS Land Sat 8 OLI
Project by Tesini Precious Dombo.
For more information, send mail to info@sambusgeospatial.com.